What’s a widget?
Image may be NSFW.
Clik here to view.
Widgets in IPython notebooks are controls that let you interactively explore a graph or dataset. As of versions >1.5.0, the Plotly Python package fully supports IPython widgets and exposes additional functionality for interactive exploration of Plotly graphs, like handlers for clicking and hovering on graph data points. To get the latest Plotly version, enter
sudo pip install plotly --upgrade
in your terminal.
Below are example IPython notebooks organized by widget type. If you’re looking for a particular example, write us at feedback@plot.ly or @plotlygraphs on Twitter. For the basics, see this overview of IPython widgets with Plotly.
Unfortunately, IPython notebooks shared on nbviewer.ipython.org can’t display widgets, so in the examples below, you’ll have to download the notebooks from the link in the upper-right corner and run them locally. There are also short video samples to give a quick idea of what each notebook does.
Example 1: sliders and fractal tree
Interactively change the parameters of an L-System fractal.

EXAMPLE 2: 3d plots with widgets
Change the frequency of a 3d wave.

EXAMPLE 3: Exploring topographies
Click 2 points on a contour map to see a 2d profile of the elevation.

EXAMPLE 4: filtering big data
Interactively explore a Pandas dataframe of NYC crime reports.

EXAMPLE 5: 3d vortex
Change the phase of a 3D vortex.

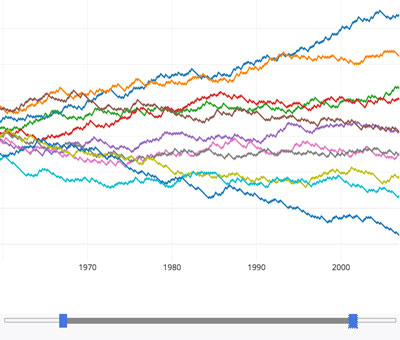
EXAMPLE 6: double slider for x-axis range
Change x-axis range with sliders.
More example IPYTHON NOTEBOOKS
Send us your IPython notebooks with widgets and we’ll list them here. feedback@plot.ly
Building interactive dashboards in Python for your company? Check out Plotly Enterprise, on-premise instances of Plotly for intracompany data science collaboration.