In this post, we will analyse the shots by P. K. Subban for the season 2015-16. He is a defenceman for the Nashville Predators of the National Hockey League.
It’s the second post in the series of posts on Plotly shapes. You can also read the first one, NBA shots analysis using Plotly shapes.
You can create SVG shapes like line, circle, rectangle, and path using Plotly’s shapes feature. With the help of these shapes, we will create the Ice Hockey rink and plot all his shots (in the season 2015-16) on it.
Data Collection
We have collected the shot location for P.K. Subban from SportingCharts’ Ice Tracker Tool. The dataset is publicly available at our datasets repository.
Creating the ice hockey rink
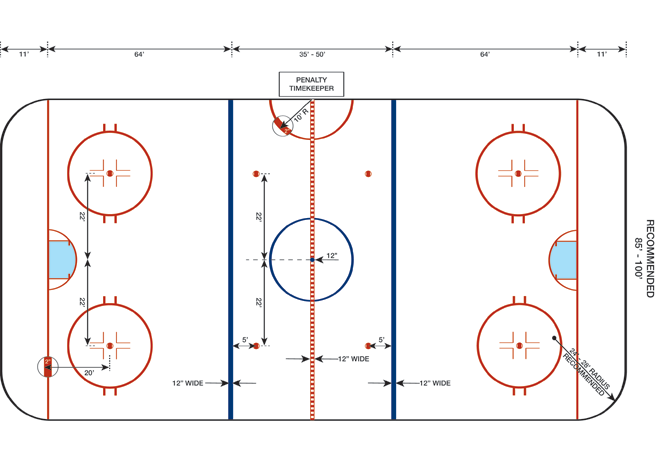
The court rink has a physical dimension of 200 ft (61 m) × 85 ft (26 m), we will use the NHL Rulebook for reference.

For the post, we will draw just the half (in height) of the rink.
The X-axis and Y-axis of our court chart will range from -250 to 250 and 0 to 580 respectively. A single unit on the chart scale is equal to 0.17 (85/500) and 0.172 (100/580) ft for X and Y axis respectively.
Outer lines
The standard size of the rink is 200 ft long and 85 ft wide. The corners are rounded in the arc of a circle with a radius of 28 ft.
We will use the Rectangle, Line, and Arc shapes to draw the outer lines. The upper side of this rectangle is a line 11 ft away from both ends of the rink.
#list containing all the shapes
rink_shapes = []

outer_rect_shape = dict(
            type='rect',
            xref='x',
            yref='y',
            x0='-250',
            y0='0',
            x1='250',
            y1='516.2',
            line=dict(
                width=1,
            )
)

rink_shapes.append(outer_rink_shape)
To support the arcs, we’ll draw a line parallel to the X-axis.
outer_line_shape = dict(
            type='line',
            xref='x',
            yref='y',
            x0='200',
            y0='580',
            x1='-200',
            y1='580',
            line=dict(
                width=1,
            )
)

rink_shapes.append(outer_line_shape)
To simulate the rounded corners, we will use the Arc shape.
outer_arc1_shape = dict(
            type='path',
            xref='x',
            yref='y',
            path='M 200 580 C 217 574, 247 532, 250 516.2',
            line=dict(
                width=1,
            )
)

rink_shapes.append(outer_arc1_shape)
We need to draw one more arc just opposite (Y-axis) to this.
red lines
It’s a red line in the center of the rink along the width.
center_red_line_shape = dict(
            type='line',
            xref='x',
            yref='y',
            x0='-250',
            y0='0',
            x1='250',
            y1='0',
            line=dict(
                width=1,
                color='rgba(255, 0, 0, 1)'
            )
)

rink_shapes.append(center_red_line_shape)
This line is 11 ft away from the end of the rink and red in color.
end_line_shape = dict(
            type='line',
            xref='x',
            yref='y',
            x0='-250',
            y0='516.2',
            x1='250',
            y1='516.2',
            line=dict(
                width=1,
                color='rgba(255, 0, 0, 1)'
            )
)

rink_shapes.append(end_line_shape)
blue line
It’s 1 ft wide along the width and located at 25 ft distance from the center red line. We will use the rect shape to give it the desired width.
blue_line_shape = dict(
            type='rect',
            xref='x',
            yref='y',
            x0='250',
            y0='150.8',
            x1='-250',
            y1='-145',
            line=dict(
                color='rgba(0, 0, 255, 1)',
                width=1
            ),
            fillcolor='rgba(0, 0, 255, 1)'
)

rink_shapes.append(blue_line_shape)
face-off spots and circles
A circular blue spot, 1 ft in diameter, shall be marked exactly in the center of the rink.
center_blue_spot_shape = dict(
            type='circle',
            xref='x',
            yref='y',
            x0='2.94',
            y0='2.8',
            x1='-2.94',
            y1='-2.8',
            line=dict(
                color='rgba(0, 0, 255, 1)',
                width=1
            ),
            fillcolor='rgba(0, 0, 255, 1)'
)

rink_shapes.append(center_blue_spot_shape)
Two red spots 2 ft in diameter shall be marked on the ice in the neutral zone 5 ft from each blue line.
red_spot1_shape = dict(
            type='circle',
            xref='x',
            yref='y',
            x0='135.5',
            y0='121.8',
            x1='123.5',
            y1='110.2',
            line=dict(
                color='rgba(255, 0, 0, 1)',
                width=1
            ),
            fillcolor='rgba(255, 0, 0, 1)'
)

rink_shapes.append(red_spot1_shape)
The second red spot in the neutral zone is the mirror image of this along with the Y-axis.
In both end zones and on both sides of each goal, red face-off spots and circles shall be marked on the ice. There will be circles of radius 15 ft as the blue and the red spots (in the end zones) as the center.
red_spot1_circle_shape = dict(
            type='circle',
            xref='x',
            yref='y',
            x0='217.6',
            y0='487.2',
            x1='41.2',
            y1='313.2',
            line=dict(
                width=1,
                color='rgba(255, 0, 0, 1)'
            )
)

rink_shapes.append(red_spot1_shape)
Face-off lines
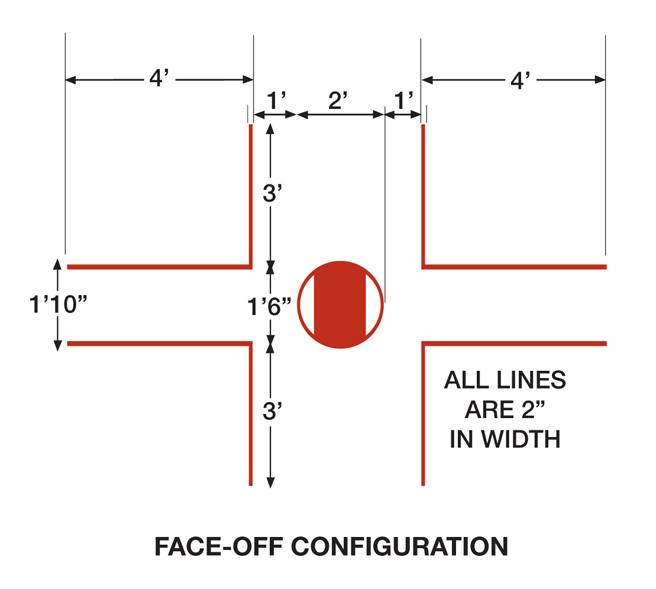
At the outer edge of both sides of each face-off circle and parallel to the goal line shall be marked two red lines, 2 inches wide and 2 ft in length and 5 ft 7 inches apart.
parallel_line1_shape = dict(
            type='line',
            xref='x',
            yref='y',
            x0='230',
            y0='416.4',
            x1='217.8',
            y1='416.4',
            line=dict(
                color='rgba(255, 0, 0, 1)',
                width=1
            )
)

parallel_line2_shape = dict(
            type='line',
            xref='x',
            yref='y',
            x0='230',
            y0='384',
            x1='217.8',
            y1='384',
            line=dict(
                color='rgba(255, 0, 0, 1)',
                width=1
            )
)

rink_shapes.append(parallel_line1_shape)
rink_shapes.append(parallel_line2_shape)
The other two red lines will be the mirror images of these line along with the Y-axis.
Here is the line configuration near face-off spots.

These four line shapes represent the approx face-off spot configuration lines.
faceoff_line1_shape = dict(
            type='line',
            xref='x',
            yref='y',
            x0='141.17',
            y0='423.4',
            x1='141.17',
            y1='377',
            line=dict(
                color='rgba(10, 10, 100, 1)',
                width=1
            )
)

faceoff_line2_shape = dict(
            type='line',
            xref='x',
            yref='y',
            x0='117.62',
            y0='423.4',
            x1='117.62',
            y1='377',
            line=dict(
                color='rgba(10, 10, 100, 1)',
                width=1
            )
)

faceoff_line3_shape = dict(
            type='line',
            xref='x',
            yref='y',
            x0='153',
            y0='406',
            x1='105.8',
            y1='406',
            line=dict(
                color='rgba(10, 10, 100, 1)',
                width=1
            )
)

faceoff_line4_shape = dict(
            type='line',
            xref='x',
            yref='y',
            x0='153',
            y0='394.4',
            x1='105.8',
            y1='394.4',
            line=dict(
                color='rgba(10, 10, 100, 1)',
                width=1
            )
)

rink_shapes.append(faceoff_line1_shape)
rink_shapes.append(faceoff_line2_shape)
rink_shapes.append(faceoff_line3_shape)
rink_shapes.append(faceoff_line4_shape)
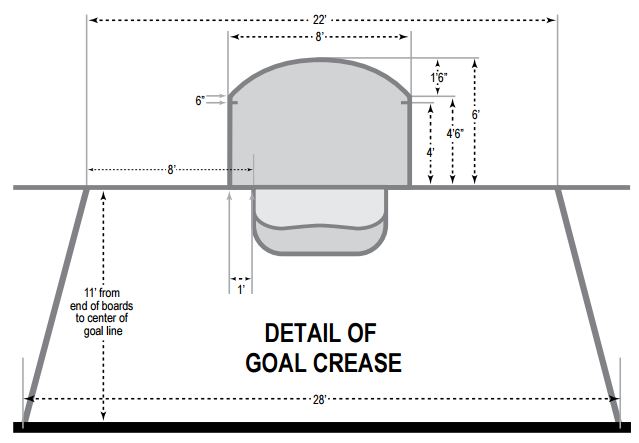
Goal Crease

goal_line1_shape = dict(
            type='line',
            xref='x',
            yref='y',
            x0='64.7',
            y0='516.2',
            x1='82.3',
            y1='580',
            line=dict(
                width=1
            )
)

goal_line2_shape = dict(
            type='line',
            xref='x',
            yref='y',
            x0='23.5',
            y0='516.2',
            x1='23.5',
            y1='493',
            line=dict(
                width=1
            )
)

# mirror images of "goal_line1" and "goal_line2" along with the Y-axis

goal_arc1_shape = dict(
            type='path',
            xref='x',
            yref='y',
            path='M 23.5 493 C 20 480, -20 480, -23.5 493',
            line=dict(
                width=1,
            )
)

goal_arc2_shape = dict(
            type='path',
            xref='x',
            yref='y',
            path='M 17.6 516.2 C 15 530, -15 530, -17.6 516.2',
            line=dict(
                width=1,
            )
)

rink_shapes.append(goal_line1_shape)
rink_shapes.append(goal_line2_shape)
rink_shapes.append(goal_arc1_shape)
rink_shapes.append(goal_arc2_shape)
Referee Crease
On the ice immediately in front of the Penalty Timekeeper’s seat there shall be marked in red on the ice a semi-circle of 10 ft radii and 2 inches in width, known as the REFEREE’s CREASE.
referee_crease_shape = dict(
            type='path',
            xref='x',
            yref='y',
            path='M ',
            line=dict(
                width=1,
                color='rgba(255, 0, 0, 1)'
            )
)

rink_shapes.append(red_spot1_shape)
Here is the resultant “Ice Hockey Rink Outline” diagram.
Point Chart for Shots
We will start from importing the JSON dataset into a pandas DataFrame object.
import plotly.graph_objs as go
from plotly.offline import init_notebook_mode, iplot
init_notebook_mode()

import pandas as pd
df = pd.read_json('data.json')
For a point chart, we will use a Scatter trace.
point_trace = go.Scatter(
    x = df['x'] - 250,
    y = 580 - df['y'],
    mode = 'markers',
    marker = dict(
        size = 4
    )
)

data = [point_trace]

layout = go.Layout(
    shapes=rink_shapes
)

fig = go.Figure(data=data, layout=layout)
iplot(fig)
Heatmap Chart for Shots
point_trace = go.Scatter(
    x = df['x'] - 250,
    y = 580 - df['y'],
    mode = 'markers',
    marker = dict(
        size = 4
    )
)

heatmap_trace = go.Histogram2dcontour(
    x=df['x'] - 250, y=580 - df['y'], name='density', ncontours=2,
    colorscale='Hot', reversescale=True, showscale=False,
    contours=dict(coloring='heatmap')
)

data = [point_trace, heatmap_trace]

layout = go.Layout(
    shapes=rink_shapes
)

fig = go.Figure(data=data, layout=layout)
iplot(fig)