Quantcast
Channel: Plotly – Modern Data
Viewing all 48 articles
Browse latest View live

Widgets in IPython notebook and Plotly

$
0
0

What’s a widget?

3d-widget-gif

Widgets in IPython notebooks are controls that let you interactively explore a graph or dataset. As of versions >1.5.0, the Plotly Python package fully supports IPython widgets and exposes additional functionality for interactive exploration of Plotly graphs, like handlers for clicking and hovering on graph data points. To get the latest Plotly version, enter

sudo pip install plotly --upgrade

in your terminal.

Below are example IPython notebooks organized by widget type. If you’re looking for a particular example, write us at feedback@plot.ly or @plotlygraphs on Twitter. For the basics, see this overview of IPython widgets with Plotly.

Unfortunately, IPython notebooks shared on nbviewer.ipython.org can’t display widgets, so in the examples below, you’ll have to download the notebooks from the link in the upper-right corner and run them locally. There are also short video samples to give a quick idea of what each notebook does.

Example 1: sliders and fractal tree

Interactively change the parameters of an L-System fractal.

fractal-widget

Link to IPython notebook

5-second demo video

Widgets: Sliders, buttons

EXAMPLE 2: 3d plots with widgets

Change the frequency of a 3d wave.

EXAMPLE 3: Exploring topographies

Click 2 points on a contour map to see a 2d profile of the elevation.

EXAMPLE 4: filtering big data

Interactively explore a Pandas dataframe of NYC crime reports.

Link to IPython notebook

5-second demo video

Widgets: Input Boxesdrop downs, sliders

EXAMPLE 5: 3d vortex

Change the phase of a 3D vortex.

EXAMPLE 6: double slider for x-axis range

Change x-axis range with sliders.

More example IPYTHON NOTEBOOKS

Plotly graph widget overview

Plotly Etch-a-Sketch

IPython widgets and Pandas

Send us your IPython notebooks with widgets and we’ll list them here. feedback@plot.ly

Building interactive dashboards in Python for your company? Check out Plotly Enterprise, on-premise instances of Plotly for intracompany data science collaboration.


Color scales in Python for humans

$
0
0

Working with colors in Python is confusing:

  • colorsys requires 0-1 decimal RGB / HSL / HSV values, and works only with single colors
  • matplotlib is heavy if you only want color conversion and interpolation
  • Cynthia Brewer’s popular color scales aren’t easily available through a pip library
  • Colors are often not displayed in formats that work with modern css
  • In IPython notebook, there are no intuitive, lightweight tools to quickly inspect color scales

… Introducing colorlover, a web-friendly color conversion and interpolation library.

To install:

sudo pip install colorlover

Here’s an example of using colorlover in IPython notebook:

import colorlover as cl
from IPython.display import HTML
HTML(cl.to_html( cl.flipper()['seq']['3'] ))

colorbrewer

Colors are displayed in RGB string format by default:
ryb = cl.scales['3']['div']['RdYlBu']; ryb

['rgb(252,141,89)', 'rgb(255,255,191)', 'rgb(145,191,219)']

And its easy to change to other color models:
cl.to_hsl( ryb )

['hsl(19.0, 96.0%, 67.0%)', 'hsl(60.0, 100.0%, 87.0%)', 'hsl(203.0, 51.0%, 71.0%)']

colorlover is ideal for charting with Plotly:
import plotly.plotly as py
from plotly.graph_objs import *
import math
un='IPython.Demo'; k='1fw3zw2o13'; py.sign_in(un,k);

bupu = cl.scales['9']['seq']['BuPu']
bupu500 = cl.interp( bupu, 500 ) # Map color scale to 500 bins
data = Data([ Scatter(
    x = [ i * 0.1 for i in range(500) ],
    y = [ math.sin(j * 0.1) for j in range(500) ],
    mode='markers',
    marker=Marker(color=bupu500,size=22.0,line=Line(color='black',width=2)),
    text = cl.to_rgb( bupu500 ),
    opacity = 0.7
)])

layout = Layout( showlegend=False, \
    xaxis=XAxis(zeroline=False), yaxis=YAxis(zeroline=False) )
fig = Figure(data=data, layout=layout)
py.iplot(fig, filename='spectral_bubblechart')

See this IPython notebook for full usage.

Documentation and code is hosted on GitHub.

Inspiration and color scales in cl.scales from Cythnia Brewer’s ColorBrewer.

3d surface plots with RStudio and Plotly

$
0
0

Recently you may have seen how to build a 3d surface plot with Plotly and IPython notebook. Here you can learn the basics of creating a 3d surface plot with Plotly in RStudio.

Just add the Plotly library into your RStudio environment then add a Plotly username and key:

install.packages("plotly")
library(plotly)
py <- plotly()
set_credentials_file(username = 'your_username', key = 'your_key')

To create a surface plot, use two vectors: x and y of length m and n, and a matrix: z of size m*n. In this example, x and y both consist of 100 points ranging from -5 to 4.9.

x_vec = c(seq(-5, 4.9, 0.1))

*note this results in the same dimensions (1 column X 100 rows) as specifying:

x_matrix = matrix(c(x_vec), nrow = 100, ncol = 1)

The size of x is 1 column with 100 rows. In order to multiply x * y to create matrix z with 100 columns and 100 rows, y should be 100 columns with 1 row.

y_matrix = matrix(c(x_vec), nrow = 1, ncol = 100)

To multiply the vertical and horizontal vectors to create matrix z in RStudio, the basic syntax is z = x %*% y. In this example, a function is applied to z to create waves. Below, dimensions x, y, and z are defined. y used here is different than y1 used above because y should be the default, 1 column vector, not 1 row x 100 columns. Type is defined as “surface”.

data <- list(
        x = x_vec,
        y = x_vec,
        z = matrix(c(cos(x_matrix %*% y_matrix) + sin(x_matrix %*% y_matrix)), nrow = 100, ncol = 100),
        type = "surface")

Finally, specify layout information and filename:

layout <- list(
          title = "Waaaves in r",
          scene = list(bgcolor = "rgb(244, 244, 248)"))

response <- py$plotly(data,
                      kwargs = list(
                                layout = layout,
                                filename = "waves example",
                                fileopt = "overwrite"))

The result will be similar to the interactive 3d plot displayed below:

Creating dashboards or visualizations at your company? Consider Plotly Enterprise for modern intracompany graph and data sharing.

Easy Error Bars with R and Plotly

$
0
0

Error bars are a great way to visually represent variability of a dataset, and are easy to graph with Plotly and R! Error bars can be used to visualize standard deviations, standard errors or confidence intervals (just don’t forget to specify which measure the error bar in the graph represents).

Below are two examples that demonstrate how to graph a variety of error bars. The complete R script and data used to create these 2 graphs are available here!

To create vertical error bars, like on the Snow line in the graph below, set

error_y = list(type = "data", array = c(YOUR_VALUES))

It is also possible to calculate and plot error bars with a percent value, like on the Rain line below. Set:

error_y = list(type = "percent", value = CHOOSE_%_VALUE)

To create horizontal error bars use error_x. Furthermore, it’s easy to graph asymmetrical error bars. Just set symmetric = FALSE and add an arrayminus array like this:

error_x = list(
          type = "data",
          symmetric = FALSE,
          array = c(YOUR_HIGH_VALUES),
          arrayminus = c(YOUR_LOW_VALUES))

Creating dashboards or visualizations at your company? Consider Plotly Enterprise for modern intracompany graph and data sharing.

Graph flight plans on a 3d globe with MATLAB Mapping Toolbox and Plotly

$
0
0

Traveling somewhere soon? Visualize your flight plan on a 3d globe with the Matlab Mapping Toolbox and Plotly!

If you haven’t used Plotly with Matlab before it’s easy to get started by following these simple instructions. Additionally, latitude & longitude flight plan data can be found online on sites such as Flight Plan Database.

With the Matlab Mapping Toolbox, construct a basic globe display.

grs80 = referenceEllipsoid('grs80','km');
figure('Renderer','opengl')
ax = axesm('globe','Geoid',grs80,'Grid','on','GLineWidth',1, ...
'GLineStyle','-', 'Gcolor',[0.9 0.9 0.1],'Galtitude',100);
axis equal off
view(3)

Next, add low-resolution global topography, coastlines, and rivers to the globe.

load topo
geoshow(topo,topolegend,'DisplayType','texturemap')
demcmap(topo)
land = shaperead('landareas','UseGeoCoords',true);
plotm([land.Lat],[land.Lon],'Color','black')
rivers = shaperead('worldrivers','UseGeoCoords',true);
plotm([rivers.Lat],[rivers.Lon],'Color','blue')

To add a flight plan, create arrays of the latitude and longitude data for the flight, then plot the latitude by longitude.

flight.Lat = [ADD LATITUDES];
flight.Lon = [ADD LONGITUDES];
plotm([flight.Lat],[flight.Lon],'Color','red')

Parse the figure with the following statement:

pf = fig2plotly(gcf,'open',false,'strip',false, 'filename', ...
'ADD_YOUR_FILENAME', 'fileopt','overwrite');

Adjust the trace style (color and line width) on the Plotly figure for {1} Latitude, {2} Longitude, {3} Surface Water, {4} Land Lines, {5} Rivers, and {6} Flight Plan

For lines (in this example: everything except Surface Water):

pf.data{1}.line.color = 'rgb(80, 20, 80)';
pf.data{1}.line.width = 0.75;
pf.data{1}.name = 'Latitude';

For surfaces (in this example: Surface Water):

pf.data{3}.colorscale = {{0,'rgb(31, 119, 180)'}, {1, 'rgb(0, 0, 0)'}};
pf.data{3}.opacity = 0.4;

Adjust the layout and axes.

pf.layout.scene.bgcolor = 'rgb(0, 0, 0)';
pf.layout.showlegend = true;

In the graph below, the axes grids are hidden. Repeat the code below for the y and z axes to hide all grid information in the plot.

pf.layout.scene.xaxis.showgrid = false;
pf.layout.scene.xaxis.zeroline = false;
pf.layout.scene.xaxis.showspikes = false;
pf.layout.scene.xaxis.showticklabels = false;

Finally, graph the figure online with Plotly!

pf.plotly;

You can find the full matlab script and data used to make the flight plans for the figure below here!

Creating dashboards or visualizations at your company? Consider Plotly Enterprise for modern intracompany graph and data sharing.

Create Colorful Graphs in R with RColorBrewer and Plotly

$
0
0

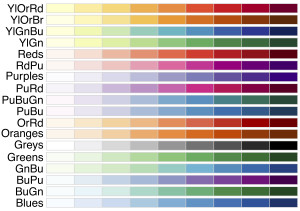
RColorBrewer is an R package that allows users to create colourful graphs with pre-made color palettes that visualize data in a clear and distinguishable manner. There are 3 categories of palettes: qualitative, diverging, and sequential.

  • Qualitative palettes employ different hues to create visual differences between classes. These palettes are suggested for nominal or categorical data sets.qual
  • Sequential palettes progress from light to dark. When used with interval data, light colors represent low data values and dark colors represent high data values.seq
  • Diverging palettes are composed of darker colors of contrasting hues on the high and low extremes and lighter colors in the middle.
    diverging2

The palettes are composed of 8-12 distinct colors, but if you have more than 12 categories to graph, you can use the colorRampPalette() function with any of the sequential or diverging palettes. This ramps the color at the necessary interval to create as many hues as your data calls for.

Below are a few examples using RColorBrewer and Plotly! The code for the first example is provided below and the full R scripts and data for the second and third examples are available here.

1) Bar Graph with the Paired palette:

First, add the libraries:

library(RColorBrewer)
library(plotly)
py <- plotly()

Add x & y data and define the type of graph as “bar”. To use RColorBrewer define

marker = list(color = brewer.pal(n_palette, "Palette_Name")

where n_palette is the number of colors from the palette that you want to use in the graph.

data_bar <- list(x = c("Breakfast 1", "Breakfast 2", "Lunch 1", "Lunch 2", "Dinner 1", "Dinner 2"),
                 y = c(7.72, 8.5, 12.22, 14.89, 27.02, 17.23),
                 type = "bar",
                 marker = list(color = brewer.pal(6, "Paired"))
)

Finally, specify any layout information and send to Plotly!

layout_bar <- list(title = "Price of Meals", xaxis = list(title = "Meal"), yaxis = list(title = "Price ($)"))
response <- py$plotly(data = data_bar, kwargs = list(layout = layout_bar, filename = "Your_Filename",                      fileopt = "overwrite")

2) Scatterplot with colorRampPalette() and the Spectral palette:

The key here is to set
colorRampPalette(brewer.pal(n_palette, "palette_name"))(n_plot),
where n_palette is the number of colors from the palette that you want to use and n_plot is the number of colors you want in your plot. For this example, we’ll use the Spectral palette. The Spectral palette has a max of 11 colors. We’ll use the full palette and we want each of the 100 points to be a different color so:

marker = list(color = colorRampPalette(brewer.pal(11,"Spectral"))(100))

3) Line Graph with ggplot syntax:

You can also use RColorBrewer with ggplot with the command scale_colour_brewer(palette = "Palette_Name"). You can view the full script for this example, but the generic syntax is:

ggplot(data = Your_Data,
       aes(x = X_Variable,
       y = Y_Variable,
       group = Group_Variable,
       colour = Group_Variable)) +
scale_colour_brewer(palette = "Palette_Name")

py$ggplotly(kwargs = list(filename = "Your_Filename",
            fileopt = "overwrite")
)

Dashboards in R with Shiny & Plotly

$
0
0

The Plotly-Shiny client has been updated with the 2.0 R client release. Read the new Plotly-Shiny client tutorial.

Shiny is an R package that allows users to build interactive web applications easily in R! Using Shiny and Plotly together, you can deploy an interactive dashboard. That means your team can create graphs in Shiny, then export and share them.

Shiny apps involve two main components: a ui (user interface) script and a server script. The user interface script controls the layout of the app and the server script controls what the app does. In other words, the ui script creates what the user sees and controls and the server script completes calculations and creates the plots.

To make a shiny app that is a plotly widget, just add 3 scripts to your app folder in addition to the ui.R and server.R. (1) global.R (2) plotlyGraphWidget.R and (3) plotlyGraphWidget.js are all available here! There’s also an optional runApp script that installs the necessary packages and makes it easy to run the app (see instructions below). The plotlyGraphWidget.js script should be inside a folder named www inside the app folder: path

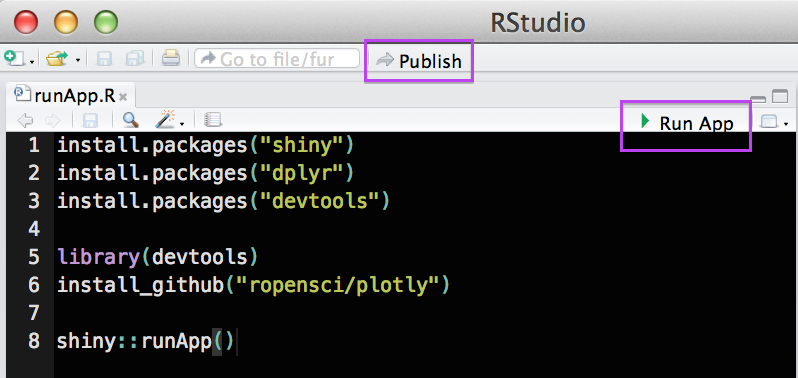
Once all of the components are stored in a folder just open the runApp.R in RStudio and select “Run App” or, if you have a Shiny Apps account, you can log in then select Publish. After publishing the app, it’s quite easy to embed the app in a website!


highlight

Alternatively, it’s possible to run the app by setting the working directory to the directory that contains the app folder and then run library(shiny) and runApp("My_App").

Examples:

Movies:
Grab the scripts here!
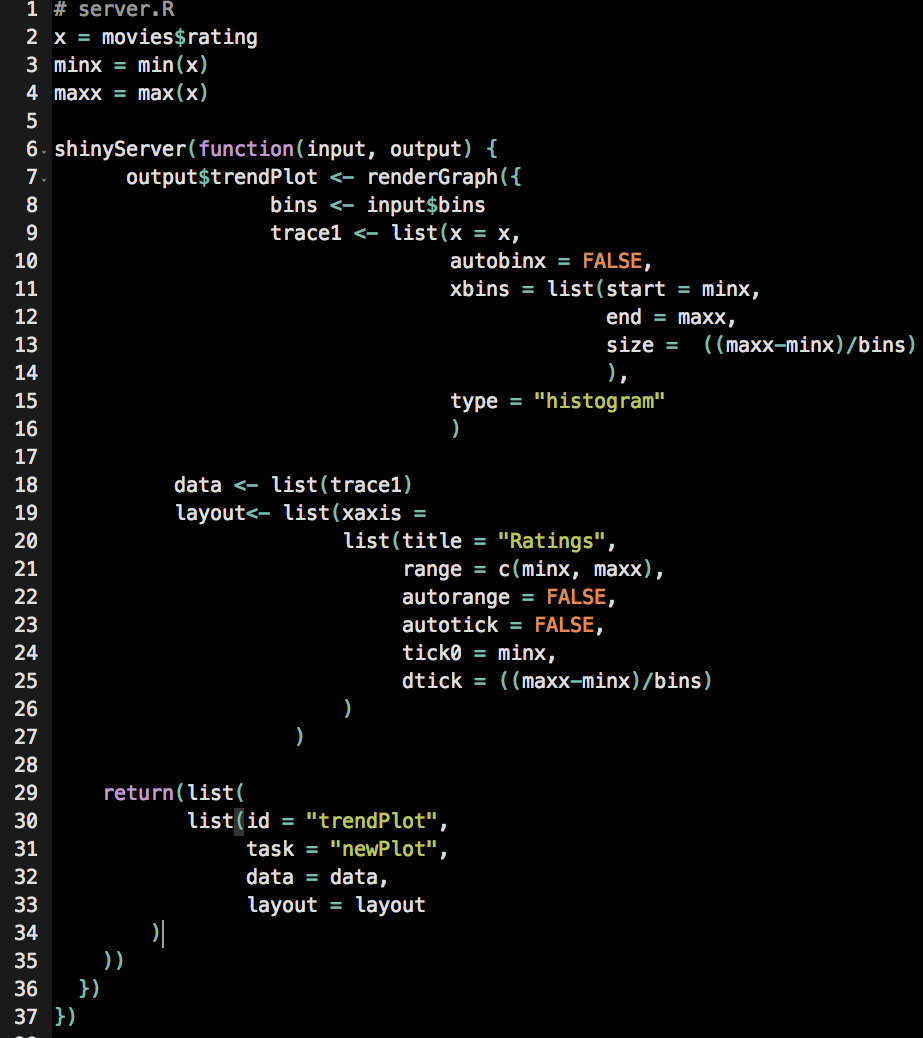
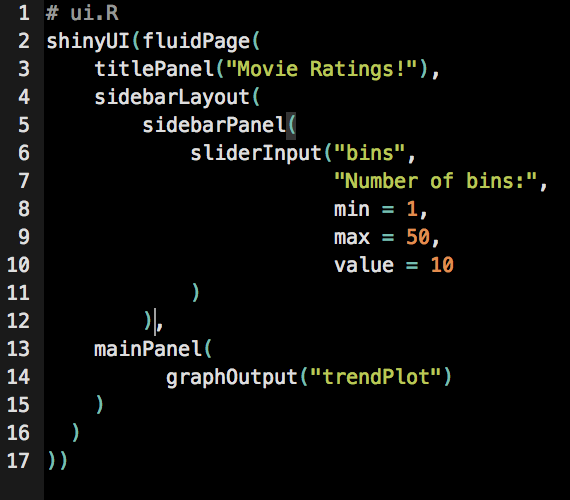
This simple example (based on Hello Shiny) uses Plotly syntax to create a histogram of movie ratings (from a ggplot/plotly built in data set) where the user can change the number of bins in the histogram. The scripts are available here. server.R  contains the graph, written in Plotly syntax and ui.R consists of a title panel, a sidebar panel with the slider to select the number of bins, and a main panel that displays the graph.

Screen Shot 2015-04-27 at 12.10.56 AMScreen Shot 2015-04-27 at 12.11.11 AM


UN Advanced:
Grab the scripts here or a simpler version here!
This example uses both ggplot and plotly syntax to create the shiny app. The structure of the server script is similar to the one in the example above with an added function: gg<-gg2list(YOUR_GGPLOT). After this point, you can use plotly syntax to make any additional edits then finally in the return set,  data = gg$data and layout = gg$layout. This server.R script also includes the code to adjust the title of the graph based on the countries that are selected for the plot and the code to add colored text annotations to the end of each line in the graph.


Diamonds:
Grab the scripts here!
This example is adapted from a ggplot/shiny example and uses the built in diamonds dataset. The variables in the graph can be edited to view the data in different ways. In addition to graphing x and y variables, the user can also add an optional color variable, and create multiple plots in columns and/or rows.


Questions? Suggestions? Email feedback[at]plot[dot]ly, use StackOverflow, or tweet to @plotlygraphs.

Are you setting up a dashboard for your company? Consider contacting Plotly Enterprise for an On-Premise Plotly appliance or support services from our team. To create a new dashboard or to request a demo for our online dashboards in R, Python and MATLAB, visit the dashboards section of Plotly’s website. For more documentation on using RShiny, take a look at this tutorial.

Connecting R to MySQL/MariaDB

$
0
0

Overview

Relational databases, such as MySQL, organize data into tables consisting of rows and columns similarly to an R data.frame. While many beginners will be satisfied with R’s native RData storage format, storing data in a flat-file has its disadvantages. First, they are difficult to share among collaborators. .RData files can contain many matrices and data.frames. It’s very easy to create different versions if two collaborators are performing analyses which require cleaning the data. Second, they are insecure compared to the permissions available to administrators of SQL databases. For example, I may want a research assistant or an analyst on the data science team to have read-only access to certain tables to prevent data corruption, and restrict access entirely to sensitive, identifiable data such as participant names and email addresses. Using MySQL, I can grant SELECT to individuals that require read-only access and each individual can have separate login credentials. Thus, if an individual leaves the academic lab or resigns from the company, I can simply disable their access. Third, you can easily backup and version your database using mysqldump or automatic backups if you choose to use Amazon’s RDS. Did you merge incorrectly or accidentally wipe your data? No problem, just roll back to a previous version. Fourth, data can be efficiently streamed into R using SQL queries. As you may know, R data is stored entirely in-memory. This means to analyze a 24 GB dataset, you’ll need at least 24GB of free RAM in your computer in addition to what’s needed to perform your analysis. Instead, if I know that I only need last month’s customers to perform an analysis, I can stream only that data into R using a query such as:

SELECT * FROM table WHERE date &gt; '2015-07-01';

If I wanted, I could automatically filter out incomplete values before it gets into R:

SELECT * FROM table WHERE date &gt; '2015-07-01' AND test_score IS NOT NULL;

Interested? In this tutorial, you will learn how to store and retrieve data from a MySQL database with R using the RMySQL package.

Installing MySQL

Since MySQL runs on a variety of platforms, I’ll demonstrate how to install it on Mac, Linux, and Windows, as well as how to provision it using Amazon RDS. These instructions are by no means flawless – feel free to email us feedback if you find problems.

Using Homebrew on OS X

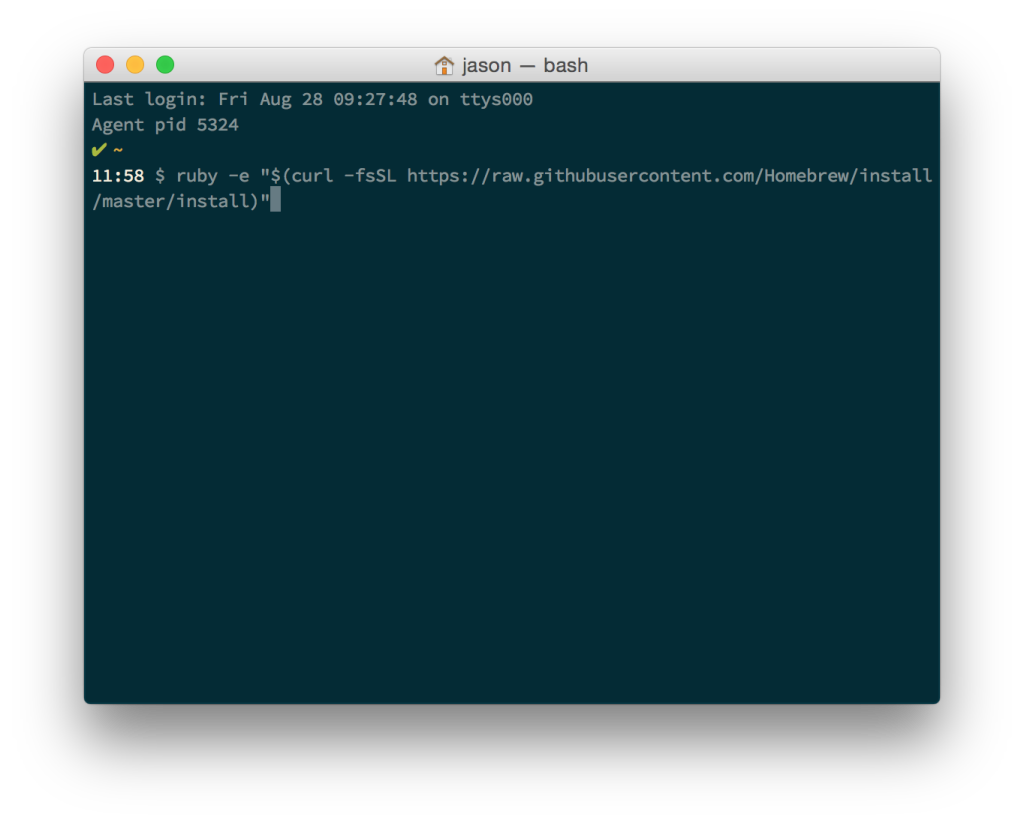
Homebrew is a package manager for OS X that enables the installation of a variety of packages from source. For our purposes, we’re going to install MySQL and run it as a daemon each time your computer starts. To install Homebrew, open Terminal.app and run the following code:

ruby -e "$(curl -fsSL https://raw.githubusercontent.com/Homebrew/install/master/install)"

Terminal.app
Terminal.app

Before doing anything, run brew doctor and make sure you fix any of its complaints before proceeding. After you have a working Homebrew installing, you can now install MySQL:

# Update Homebrew
brew update
# Install MySQL
brew install MySQL
# Tell MySQL to load at startup
ln -sfv /usr/local/opt/mysql/*.plist ~/Library/LaunchAgents
launchctl load ~/Library/LaunchAgents/homebrew.mxcl.mysql.plist

Congrats! Try logging in:

mysql -uroot

You can also try mycli, which offers a more modern CLI for MySQL with features such as syntax completion. If that command fails, check that the server is actually running:

ps -ax | grep mysqld

Installing MySQL on Ubuntu

Ubuntu

Chances are, you may have an existing server in your lab or on an EC2 instance that you want to use for this tutorial. If you don’t, I highly recommend you sign up for Amazon’s Free Tier and try it out. Luckily, Linux distributions such as Ubuntu and Fedora come with package managers that make installing MySQL easier for end-users. In this example, we’ll use the APT package manager to complete the installation. Remember, you’ll need sudo access to complete this installation. If you don’t have administrative access, contact your server administrator and ask them to install MySQL for you.

# Update APT
sudo apt-get update
# Install the server and client
sudo apt-get install mysql-server-5.6 mysql-client-5.6

If you’re also using R on the same system, you can install RMySQL using APT. The benefit is that you avoid troubleshooting any compilation errors. However, you may want to add the official CRAN repo to your APT sources.list file before doing this. In my case, I verified my Ubuntu version by running lsb_release -a and added the following line to my APT sources list at /etc/apt/sources.list: deb http://cran.rstudio.org/bin/linux/ubuntu trusty/. Once you have the CRAN Ubuntu repo installed and have updated APT, you can install many CRAN plugins from APT:

sudo apt-get install r-cran-rmysql

Setting up RDS on AWS

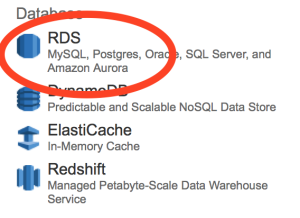
First, sign up for AWS using your Amazon account. Once you’re in, navigate to the RDS section under “Databases”:

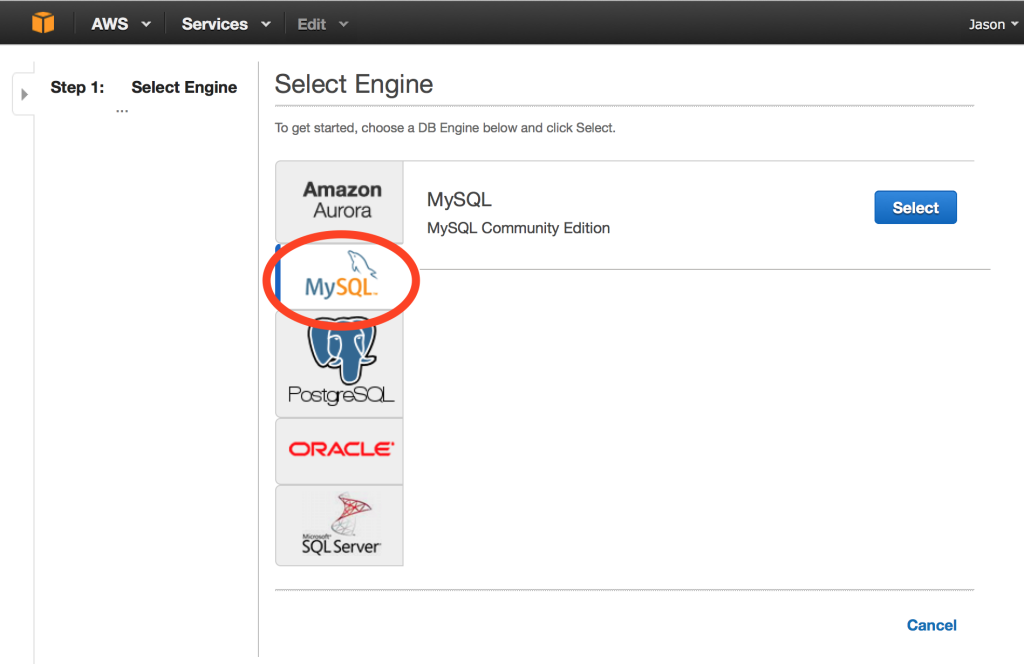
rdsNext, click on “Get Started Now” to proceed to the DB type selection screen and select “MySQL” as the type.

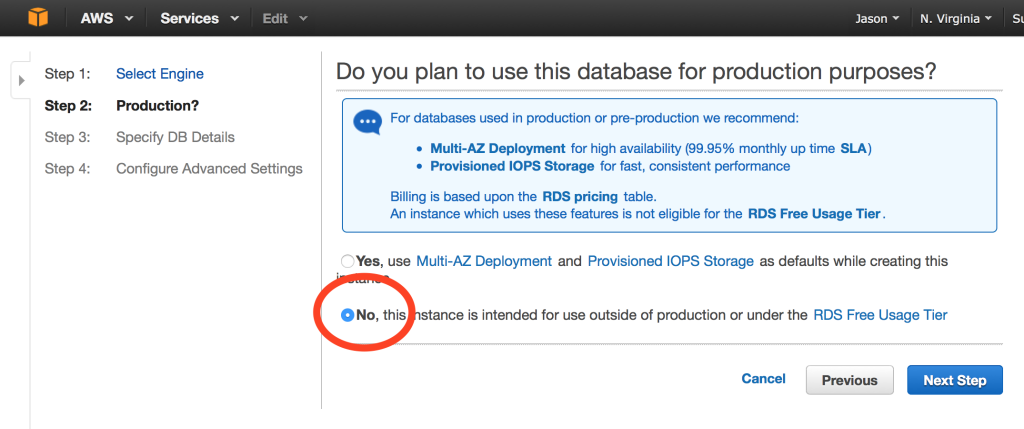
DB SelectionAfter you’ve selected a MySQL database, select “No” for Multi-AZ Zone Deployment, depending on if you want to use the Free Tier for the first year of your RDS server:

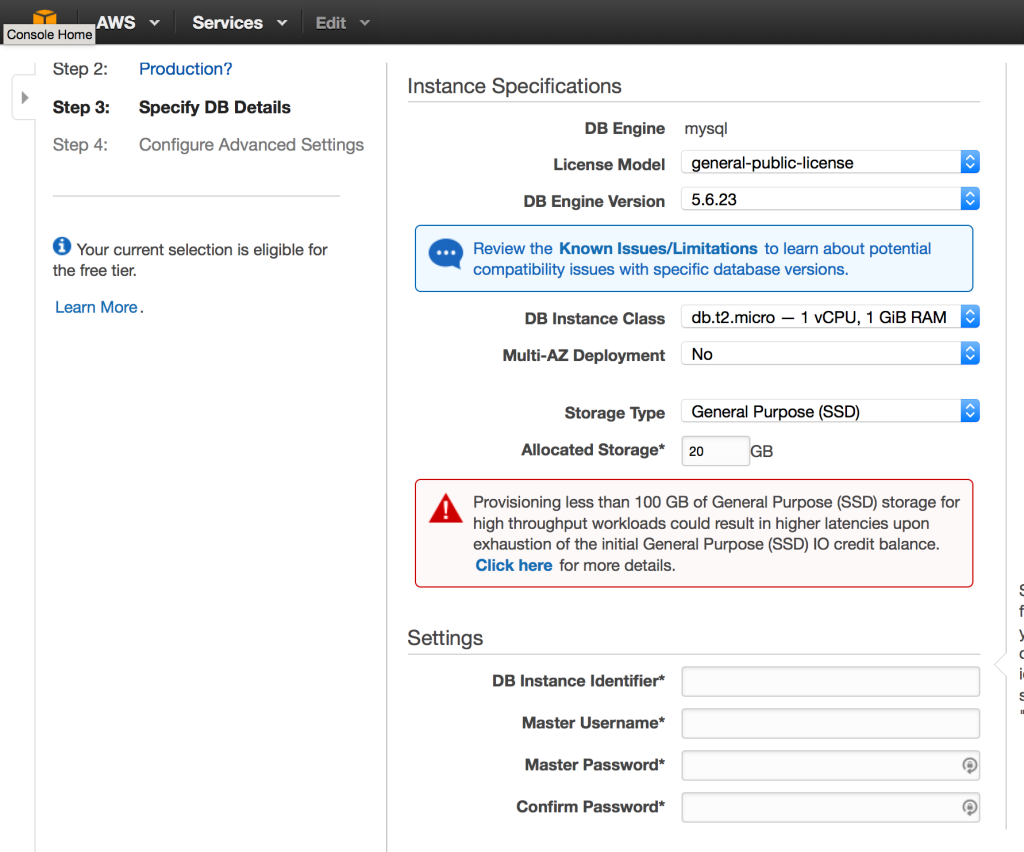
multiazNext, select the size and indicate the master username and password for your new database.  Keep in mind that databases >= 20GB are still eligible for the RDS Free-Tier:

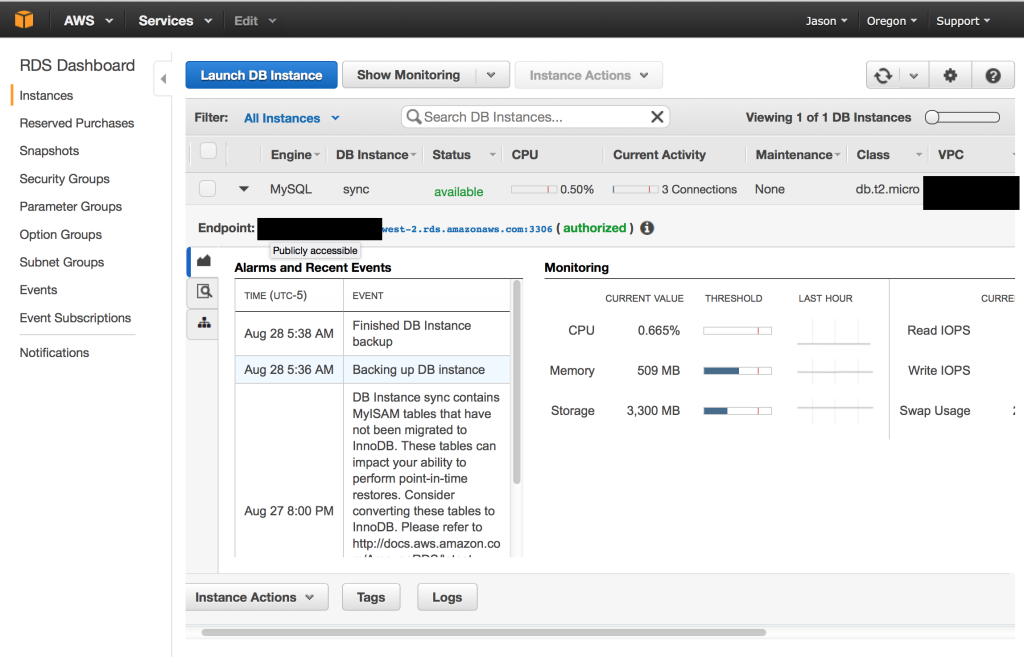
db credentialsWhen the provisioning is finished, you should see your Instance and the endpoint you’ll use for connecting using RMySQL!

Screen Shot 2015-08-28 at 12.10.37 PM

Installing RMySQL

Next, we’re going to install another package to extend R’s native capabilities and allow it to read and write from MySQL. First, try to install the binary package from CRAN:

install.packages("RMySQL")
# Load the library
library(RMySQL)

If you don’t get any errors, you’re all set! However, depending on your version of R and your platform, you may have to build from source. If that’s the case, don’t fret! As long as you’ve installed the MySQL headers (for example, using Homebrew) you’ll be able to specify that you want to install RMySQL from source, in which it will compile the package:

install.packages("RMySQL", type = "source"&gt;
library(RMySQL)
Loading required package: DBI

Transferring Data

Next, we’ll discover how to read to and write data from a table in your MySQL database. This tutorial won’t deal with the best ways to store data, but I highly recommend the reader take a peak at Wickham, H. (2014). Tidy Data. RMySQL contains many functions, but the three we’ll focus on are 1) dbListTables(), dbReadTables(), and dbWriteTable(). These, as you’ve no doubt already guessed, allow you to 1) list all the tables available in a given database, read a MySQL table into R as a data.frame, and write to a MySQL table in a way conceptually similar to how write.csv() operates. First, let’s create the connection to the database and explore how some of the functions operate.  Note that in my case, dbListTables() returns a character vector with each table name because I’m connecting to an existing database.  New databases should not return anything.

library(DBI)
con_sql &lt;- </code>dbConnect(<span class="pl-e">RMySQL</span><span class="pl-k">::</span>MySQL(), <span class="pl-v">group</span> <span class="pl-k">=</span> <span class="pl-s"><span class="pl-pds">"</span>group-name<span class="pl-pds">"</span></span>)

# List tables in current database
dbListTables(con_sql)
[1] "year1" "year2" "year3" "year4"

# Write data.frame to MySQL
dbWriteTable(conn = con_sql, name = 'mtcars', value = mtcars)

# Read MySQL table to data.frame
mtcars &lt;- dbReadTable(conn = con_sql, name = 'mtcars')

# Check out your data!
head(mtcars)
                   mpg cyl disp  hp drat    wt  qsec vs am gear carb
Mazda RX4         21.0   6  160 110 3.90 2.620 16.46  0  1    4    4
Mazda RX4 Wag     21.0   6  160 110 3.90 2.875 17.02  0  1    4    4
Datsun 710        22.8   4  108  93 3.85 2.320 18.61  1  1    4    1
Hornet 4 Drive    21.4   6  258 110 3.08 3.215 19.44  1  0    3    1
Hornet Sportabout 18.7   8  360 175 3.15 3.440 17.02  0  0    3    2
Valiant           18.1   6  225 105 2.76 3.460 20.22  1  0    3    1

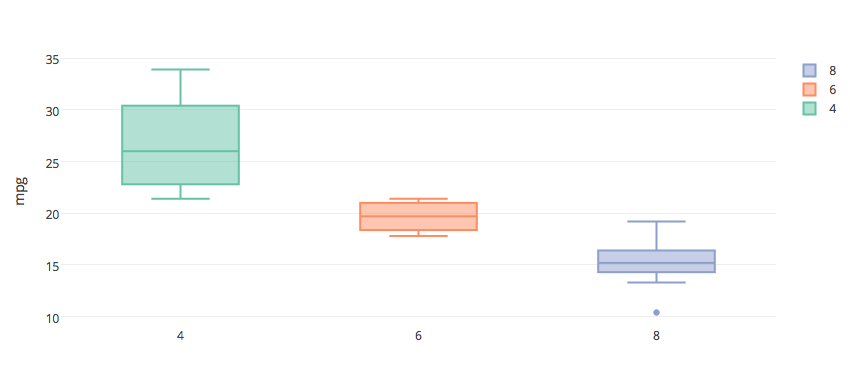
Since the result of dbReadTable() is itself a data.frame, you can stream SQL directly into your plot.ly graphs and play around as usual. This functionality is fantastic for building persistent dashboards for your analysis.

library(plotly)
plot_ly(data = mtcars, color = as.factor(cyl), y = mpg, type = "box")

Screen Shot 2015-09-02 at 1.32.18 PM

Securing your Credentials in R

You’ll notice that in my example above I didn’t embed my credentials directly in my R script. Scripting usernames and passwords is a terrible idea in practice. For example, what if you upload your analysis to a public Github? Suddenly, the world knows that your password is ilovecats!. We can avoid such embarrassment by storing our credentials in a .my.cnf configuration file that RMySQL will look for and read. Values such as the database name, your username, and corresponding password can then be safely stored in your $HOME directory, away from your analysis. To do this, create a file called my.cnf in your home directory:

[group-name]
database=test
user=root
password=
host=127.0.0.1

Going Further

While this post is mainly concerned with 1) connecting R to MySQL databases and 2) reading and writing data, I encourage readers to check out the Khan Academy’s free course on SQL. Using the dbSendQuery() function, we can perform more complex queries that involve joining and subsetting data before they’re read into R:

query &lt;- dbSendQuery(con_sql, "select * from mtcars where cyl = 4;")
data &lt;- fetch(query, n=10)
dbClearResult(query)


Regression Diagnostic Plots using R and Plotly

$
0
0


Plotly is a platform for making, editing, and sharing customizable and interactive graphs. Embedding Plotly graphs in a R-Markdown document is very easy. Here, we will genarate a R-Markdown document with embedded Plotly charts to visualize regression diagnostic plots similar to the ones generated by using plot() on a fitted lm() object.

R-Studio

First step is to install R-Studio. R-Studio makes it very easy to write R-Markdown documents.

Install Plotly

Run the following command(s) in the console

# Not run
# install.packages("plotly")
# install.packages("MASS")
library(plotly)

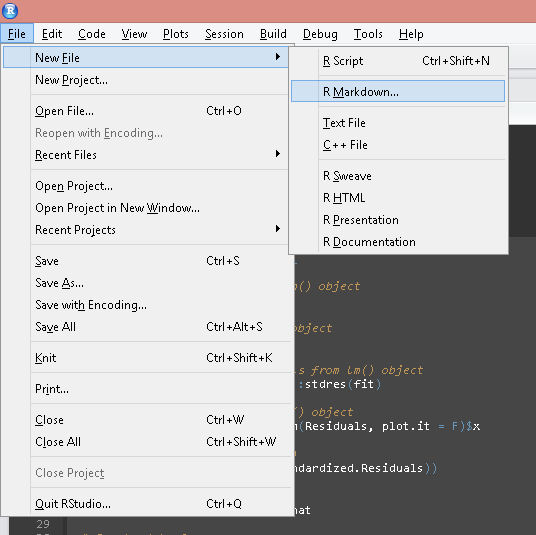
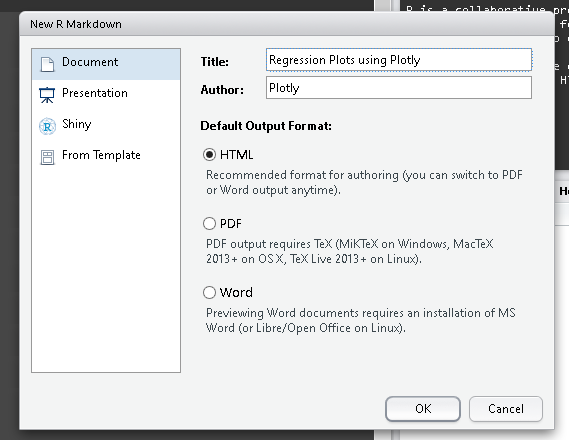
Start a new R-Markdown document

For an introduction to R-Markdown visit http://rmarkdown.rstudio.com/

Function to generate plots

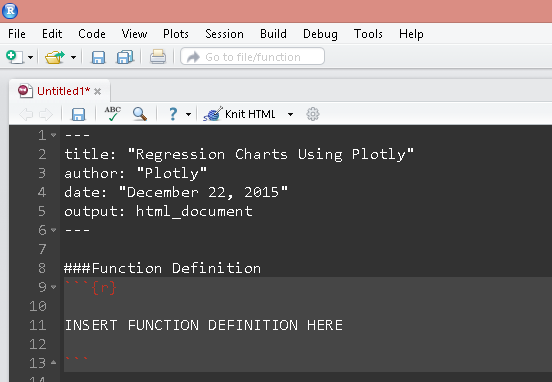
The following code snippet creates a function that accepts a fitted lm() object and returns plotly charts. Paste the following code snippet(s) as chunks in the R-Markdown document as shown.

RegressionPlots <- function(fit){
  
  # Extract fitted values from lm() object
  Fitted.Values <-  fitted(fit)
  
  # Extract residuals from lm() object
  Residuals <-  resid(fit)
  
  # Extract standardized residuals from lm() object
  Standardized.Residuals <- MASS::stdres(fit)  
  
  # Extract fitted values for lm() object
  Theoretical.Quantiles <- qqnorm(Residuals, plot.it = F)$x
  
  # Square root of abs(residuals)
  Root.Residuals <- sqrt(abs(Standardized.Residuals))
  
  # Calculate Leverage
  Leverage <- lm.influence(fit)$hat
  
  # Create data frame 
  # Will be used as input to plot_ly
  
  regMat <- data.frame(Fitted.Values, 
                       Residuals, 
                       Standardized.Residuals, 
                       Theoretical.Quantiles,
                       Root.Residuals,
                       Leverage)
  
  # Plot using Plotly
  
  # Fitted vs Residuals
  # For scatter plot smoother
  LOESS1 <- loess.smooth(Fitted.Values, Residuals)
  
  plt1 <- regMat %>% 
    plot_ly(x = Fitted.Values, y = Residuals, 
            type = "scatter", mode = "markers", hoverinfo = "x+y", name = "Data",
            marker = list(size = 10, opacity = 0.5), showlegend = F) %>% 
    
    add_trace(x = LOESS1$x, y = LOESS1$y, type = "scatter", mode = "line", name = "Smooth",
              line = list(width = 2)) %>% 
    
    layout(title = "Residuals vs Fitted Values", plot_bgcolor = "#e6e6e6", width = 1000)
    
  # QQ Pot
  plt2 <- regMat %>% 
    plot_ly(x = Theoretical.Quantiles, y = Standardized.Residuals, 
            type = "scatter", mode = "markers", hoverinfo = "x+y", name = "Data",
            marker = list(size = 10, opacity = 0.5), showlegend = F) %>% 
    
    add_trace(x = Theoretical.Quantiles, y = Theoretical.Quantiles, type = "scatter", mode = "line", name = "",
              line = list(width = 2)) %>% 
    
    layout(title = "Q-Q Plot", plot_bgcolor = "#e6e6e6")
  
  # Scale Location
  # For scatter plot smoother
  LOESS2 <- loess.smooth(Fitted.Values, Root.Residuals)
  
  plt3 <- regMat %>% 
    plot_ly(x = Fitted.Values, y = Root.Residuals, 
            type = "scatter", mode = "markers", hoverinfo = "x+y", name = "Data",
            marker = list(size = 10, opacity = 0.5), showlegend = F) %>% 
    
    add_trace(x = LOESS2$x, y = LOESS2$y, type = "scatter", mode = "line", name = "Smooth",
              line = list(width = 2)) %>% 
    
    layout(title = "Scale Location", plot_bgcolor = "#e6e6e6", width = 1000)
  
  # Residuals vs Leverage
  # For scatter plot smoother
  LOESS3 <- loess.smooth(Leverage, Residuals)
  
  plt4 <- regMat %>% 
    plot_ly(x = Leverage, y = Residuals, 
            type = "scatter", mode = "markers", hoverinfo = "x+y", name = "Data",
            marker = list(size = 10, opacity = 0.5), showlegend = F) %>% 
    
    add_trace(x = LOESS3$x, y = LOESS3$y, type = "scatter", mode = "line", name = "Smooth",
              line = list(width = 2)) %>% 
    
    layout(title = "Leverage vs Residuals", plot_bgcolor = "#e6e6e6")
  
  plt = list(plt1, plt2, plt3, plt4)
  return(plt)
}

Create regression model

Let’s create a sample regression model using the mtcars dataset.

fit = lm(mpg ~ cyl + wt + disp, data = mtcars)

Call function

We can simply pass the fitted lm object to the above function.

plt = RegressionPlots(fit)

Plot

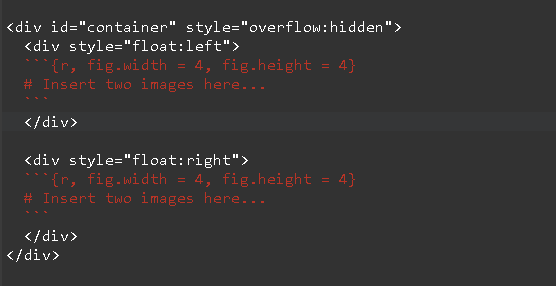
Note that the function returns a list of four plots. Unlike par(mfrow = c()) we’ll use <div> tags to arrange the four plots in a matrix like layout of 2 rows and 2 columns. Use the fig.width and fig.height chunk options to set appropriate plot width and height. Simply use double square brackets [[]] to refer to each figure and print the same. Or you could use print(). See image below.


The output should look like this:


Further Resources

This post hopefully helps you get started with Ploty and using it in R-Markdown documents. Refer to Plotly’s Figure Reference for more details.


Voronoi Diagrams in Plotly and R

$
0
0

Here’s a function which uses plotly’s R Library to overlay a voronoi diagram on top of a 2-D K-Means visualization.

Visit the Getting Started section to get Plotly up and running using R.

Here’s a quick rundown on how this function works:

  • Accepts a data frame containing x and y coordinates of a bunch of data points
  • The dataframe must have a cluster column specifying the k-means cluster to which point belongs to
  • The function uses the deldir package to compute the Voronoi tesselation
  • The function then uses some co-ordinate geometry to create the final visualization using plot_ly
  • If interested, set the parameter print.ggplot to TRUE to see a diagnostic intermediary plot
  • Try modifying the n.sd.x and n.sd.y parameters to adjust x-axis and y-axis limits

Note that this is more of a hack and I am sure there are better more elegant ways to do this. If you have suggestions let us know !

Function definition

# Function Definition ---------------------------------------------------------
VoronoiPlotly <- function(fit,  # Fit object from K-Means
                          ds,  # Data frame containing original data and clusters from K-Means
                          n.sd.x = 3,  # Controls the width of the plot
                          n.sd.y = 3,  # Controls the height of the plot
                          print.ggplot = FALSE,  # Plots a diagnostic chart using ggplot2
                          point.opacity = 0.8,  
                          point.size = 7, 
                          point.symbol = "circle",
                          point.linewidth = 2,
                          point.lineopacity = 0.5,
                          plot_bgcolor = "#ffffff",
                          paper_bgcolor = "#ffffff",
                          center.size = 15,
                          shapes.opacity = 0.5,
                          shapes.linecolor = "#404040", 
                          center.color = "#000000"){
  
  # Options
  options(stringsAsFactors = F)
  graphics.off()
  
  # Load libraries ------------------------------------------------------------
  library(plotly)
  library(deldir)
  
  # Create convenience data frames ----------------------------------------------
  centers <- data.frame(fit$centers)
  vor <- deldir(centers)
  
  # Calculate slopes
  vor.df <- data.frame(vor$dirsgs, m = (vor$dirsgs$y2- vor$dirsgs$y1)/(vor$dirsgs$x2 - vor$dirsgs$x1))
  
  # Calculate constants
  vor.df$c <- with(vor.df, ((y2 - m*x2) + (y1 - m*x1))/2)
  
  # Covnert to strings for better matching later on
  vor.df.str <- data.frame(C1 = apply(vor.df[,1:2], 1, paste, collapse = ","),
                           C2 = apply(vor.df[,3:4], 1, paste, collapse = ","))
  
  # Combine the x and y coordinates for each segment
  coord.df <- rbind(as.matrix(vor.df[1:2]), as.matrix(vor.df[,3:4]))
  
  # Convert to string
  coord.df.str <- apply(coord.df, 1, paste, collapse = ",")
  
  # Find unique strings
  count <- sapply(coord.df.str, function(x){sum(coord.df.str == x)})
  coord.df.str <- data.frame(str = coord.df.str, count = count)
  coord.df.str <- subset(coord.df.str, count == 1)
  
  # Get outer boundary co-ordinates
  outer.bound <- matrix(as.numeric(unlist(strsplit(coord.df.str$str, ","))), ncol = 2, byrow = T)
  outer.bound <- data.frame(x = outer.bound[,1], y = outer.bound[,2])
  
  # Add respective slopes and constants
  for(i in 1:nrow(outer.bound)){
    str <- coord.df.str[i,1]
    idx <- ifelse(is.na(match(str, vor.df.str$C1)), match(str, vor.df.str$C2), match(str, vor.df.str$C1))
    
    # Slope
    outer.bound$m[i] <- vor.df$m[idx]
    
    # Constants
    outer.bound$c[i] <- vor.df$c[idx]
  }
  
  # Find enclosing rectangle boundaries -----------------------------------------
  x.min <- mean(ds$x) - n.sd.x*sd(ds$x)
  x.max <- mean(ds$x) + n.sd.x*sd(ds$x)
  y.min <- mean(ds$y) - n.sd.y*sd(ds$y)
  y.max <- mean(ds$y) + n.sd.y*sd(ds$y)
  
  # Create x-axsi and y-axis limits
  xlim <- c(x.min, x.max)
  ylim <- c(y.min, y.max)
  
  # Extend outer boundary points to above rectangle ------------------------------
  for(i in 1:nrow(outer.bound)){
    # Extract x-y coordinates
    x <- outer.bound$x[i]
    y <- outer.bound$y[i]
    
    # Get slope
    m <- outer.bound$m[i]
    
    # Get slope
    c <- outer.bound$c[i]
    
    # Extend to each edge of enclosing rectangle
    ext.coord <- mat.or.vec(4,3)
    
    # Extend to left edge
    ext.coord[1,1] <- x.min
    ext.coord[1,2] <- m*x.min + c
    ext.coord[1,3] <- sqrt((ext.coord[1,1] - x)^2 + (ext.coord[1,2] - y)^2)
    
    # Extend to right edge
    ext.coord[2,1] <- x.max
    ext.coord[2,2] <- m*x.max + c
    ext.coord[2,3] <- sqrt((ext.coord[2,1] - x)^2 + (ext.coord[2,2] - y)^2)
    
    # Extend to top edge
    ext.coord[3,2] <- y.max
    ext.coord[3,1] <- (y.max - c)/m
    ext.coord[3,3] <- sqrt((ext.coord[3,1] - x)^2 + (ext.coord[3,2] - y)^2)
    
    # Extend to bottom edge
    ext.coord[4,2] <- y.min
    ext.coord[4,1] <- (y.min - c)/m
    ext.coord[4,3] <- sqrt((ext.coord[4,1] - x)^2 + (ext.coord[4,2] - y)^2)
    
    # Find the closest edge
    idx <- which.min(ext.coord[,3])
    
    x <- ext.coord[idx,1]
    y <- ext.coord[idx,2]
    
    # Insert into outer bound 
    outer.bound$x.ext[i] <- x
    outer.bound$y.ext[i] <- y
  }
  
  # Convert to string for easier searcing later on
  outer.bound.str <- apply(outer.bound[,5:6], 1, paste, collapse = ",")
  
  # Augment vor.df with extended outer bound coordinates -------------------------
  for(i in 1:nrow(outer.bound)){
    # Convert to string to help matching
    str <- paste(outer.bound[i,1:2], collapse = ",")
    
    # Match with original vor.df
    if(is.na(match(str, vor.df.str$C1))){
      idx <- match(str, vor.df.str$C2)
      vor.df[idx, 3:4] <- outer.bound[i, 5:6]
    }else{
      idx <- match(str, vor.df.str$C1)
      vor.df[idx, 1:2] <- outer.bound[i, 5:6]
    }
  }
  
  # Plot Check ------------------------------------------------------------------
  p.ggplot <- ggplot() +
    geom_point(data = centers, aes(x, y), color= "red", size = 5) +
    geom_point(data = ds, aes(x, y, color = cluster)) +
    geom_segment(data = vor.df, aes(x = x1, y = y1, xend = x2, yend = y2)) +
    geom_point(data = as.data.frame(fit$centers), aes(x, y)) +
    geom_text(data = centers, aes(x,y, label = 1:nrow(centers)), size = 10) +
    geom_point(data = outer.bound, aes(x.ext, y.ext), color = "blue", size = 5) + 
    geom_point(data = outer.bound, aes(x, y), color = "red", size = 5) + 
    geom_hline(yintercept = y.min) + 
    geom_hline(yintercept = y.max) + 
    geom_vline(xintercept = x.min) +
    geom_vline(xintercept = x.max)
  p.ggplot <- ggplotly(p.ggplot)
  if(print.ggplot == T){print(p.ggplot)}
  # -----------------------------------------------------------------------------
  
  # Function to calculate which side of line is point on ------------------------
  sideFUNC <- function(x, y, x1, y1, x2, y2){
    d <- (x - x1)*(y2-y1) - (y - y1)*(x2 - x1)
    
    return(round(d,2))
  }
  
  # Figure out the path for each polygon ----------------------------------------
  path <- list()
  
  # Loop thorough each centroid and find corrosponding edges
  for(i in 1:nrow(centers)){
    # Find each row where centeroid is available
    mat <- subset(vor.df, ind1 == i | ind2 == i)
    
    # Find all unique coordinates associated with centroid
    mat <- cbind(matrix(c(mat$x1, mat$x2), ncol = 1), matrix(c(mat$y1, mat$y2), ncol = 1))
    mat <- unique(mat)
    mat.str <- apply(mat, 1, paste, collapse = ",")
    
    # print(mat)
    
    # Find all outer boundary points asociated with centroid
    # If an outer boundary point is found, there must be atleast two
    idx <- outer.bound.str %in% mat.str
    if(sum(idx) == 2){
      # Only if two outer boundary points are found
      # then need to modify matrix and add edge end points
      
      # Find the side where all other outer boundary points are
      # Assuming all other boundary points are on the same side
      # need only one point to find this out
      p <- as.numeric(unlist(strsplit(outer.bound.str[!idx][1], split = ",")))
      
      # Line segment is defined by the two identified outer boundary points 
      p1 <- as.numeric(unlist(strsplit(outer.bound.str[idx][1], split = ",")))
      p2 <- as.numeric(unlist(strsplit(outer.bound.str[idx][2], split = ",")))
      
      # Find side
      side <- sideFUNC(p[1], p[2], p1[1], p1[2], p2[1], p2[2])
      
      # Case when only two cluster and hence only one dividing segment
      if(is.na(side)){
        side <- sideFUNC(centers[i,1], centers[i,2], p1[1], p1[2], p2[1], p2[2])
      }
      
      if(side != 0){
        
        # Find the enclosing rectangle"s endpoints that are on the opposite side
        # Top - Left
        side.check <- sideFUNC(x.min, y.max, p1[1], p1[2], p2[1], p2[2])
        if(side.check != 0){if(sign(side.check) != sign(side)) {mat <- rbind(mat, c(x.min, y.max))}}
        
        # Bottom - Left
        side.check <- sideFUNC(x.min, y.min, p1[1], p1[2], p2[1], p2[2])
        if(side.check != 0){if(sign(side.check) != sign(side)) {mat <- rbind(mat, c(x.min, y.min))}}
        
        # Top - Right
        side.check <- sideFUNC(x.max, y.max, p1[1], p1[2], p2[1], p2[2])
        if(side.check != 0){if(sign(side.check) != sign(side)) {mat <- rbind(mat, c(x.max, y.max))}}
        
        # Bottom - Right
        side.check <- sideFUNC(x.max, y.min, p1[1], p1[2], p2[1], p2[2])
        if(side.check != 0){if(sign(side.check) != sign(side)) {mat <- rbind(mat, c(x.max, y.min))}}
      }
    }
    
    # print(mat)
    # readline("Enter:")
    
    # Re-order the points to ensure it makes a convex polygon
    mat <- mat[chull(mat),]
    
    #Paste together
    path[[i]] <- paste0("M", paste0(mat[1,], collapse = ","))
    
    path[[i]] <- paste(path[[i]],
                       paste(apply(matrix(mat[-1,], ncol = 2), 1, function(x){
                         vec <- paste0(x, collapse = ",")
                         vec <- paste0("L", vec)
                       }), collapse = " "),
                       "Z")
  }
  
  # Finally plot using Plotly ---------------------------------------------------
  # crate a "shapes" list for voronoi polygons to be passed to layout()
  shapes <- list()
  cols <- RColorBrewer::brewer.pal(nrow(centers), "Paired")
  
  # Loop through each path and add params like fill color, opacity etc
  for(i in 1:length(path)){
    shapes[[i]] <- list(type = "path",
                        path = path[[i]],
                        fillcolor = cols[i],
                        opacity = shapes.opacity,
                        line = list(color = shapes.linecolor))
  }
  
  # Change colors for each cluster to allow manual spec
  for(i in 1:nrow(centers)){
    ds$color[ds$cluster == i] <- cols[i]
  }
  
  # Create plot
  # base layer
  p <- plot_ly(ds, x = x, y = y , mode = "markers", name = "Clusters", opacity = point.opacity, 
               hoverinfo = "x+y+text",
               text = paste("Cluster:",cluster),
               marker = list(symbol = point.symbol, color = color, size = point.size, 
                             line = list(color = "#262626", width = point.linewidth, opacity = point.lineopacity)),
               showlegend = F)
  
  # Add centroids
  p <- add_trace(centers, x = x, y = y, mode = "markers", name = "Cluster Centers",
                 hoverinfo = "none",
                 marker = list(color = center.color, symbol = "cross", size = center.size))
  
  # Add polygons
  p <- layout(title = "Voronoi polygons and K- Means clustering",
              paper_bgcolor = paper_bgcolor,
              plot_bgcolor = plot_bgcolor,
              xaxis = list(range = xlim, zeroline = F),
              yaxis = list(range = ylim, zeroline = F),
              shapes = shapes)

  print(p)
}

Function call

# Generate some random numbers ------------------------------------------------
set.seed(12345)
nClust <- 12 # Number of clusters
nPoints <- 2000  # Number of data points

ds <- data.frame(x = rnorm(nPoints), y = rnorm(nPoints))

# Do K-Means Clustering -------------------------------------------------------
fit <- kmeans(ds, centers = nClust)
ds <- cbind(ds, cluster = as.factor(fit$cluster))

# Call function ---------------------------------------------------------------
VoronoiPlotly(fit, ds, n.sd.x = 3, n.sd.y = 3, print.ggplot = F)

Another example

set.seed(12345)
nClust <- 8 # Number of clusters
nPoints <- 2000  # Number of data points

ds <- data.frame(x = rchisq(nPoints, 10, 0), y = rnorm(nPoints))

# Do K-Means Clustering -------------------------------------------------------
fit <- kmeans(ds, centers = nClust)
ds <- cbind(ds, cluster = as.factor(fit$cluster))

# Call function ---------------------------------------------------------------
VoronoiPlotly(fit, ds, n.sd.x = 2, n.sd.y = 3, print.ggplot = F)

Portfolio Optimization using R and Plotly

$
0
0

In this post we’ll focus on showcasing Plotly’s WebGL capabilities by charting financial portfolios using an R package called PortfolioAnalytics. The package is a generic portfolo optimization framework developed by folks at the University of Washington and Brian Peterson (of the PerformanceAnalytics fame).

You can see the vignette here

Let’s pull in some data first.

library(PortfolioAnalytics)
library(quantmod)
library(PerformanceAnalytics)
library(zoo)
library(plotly)

# Get data
getSymbols(c("MSFT", "SBUX", "IBM", "AAPL", "^GSPC", "AMZN"))

# Assign to dataframe
# Get adjusted prices
prices.data <- merge.zoo(MSFT[,6], SBUX[,6], IBM[,6], AAPL[,6], GSPC[,6], AMZN[,6])

# Calculate returns
returns.data <- CalculateReturns(prices.data)
returns.data <- na.omit(returns.data)

# Set names
colnames(returns.data) <- c("MSFT", "SBUX", "IBM", "AAPL", "^GSPC", "AMZN")

# Save mean return vector and sample covariance matrix
meanReturns <- colMeans(returns.data)
covMat <- cov(returns.data)

Now that we have some data, let’s get started by creating a portfolio specification. This can be done by using portfolio.spec()

# Start with the names of the assets
port <- portfolio.spec(assets = c("MSFT", "SBUX", "IBM", "AAPL", "^GSPC", "AMZN"))

Now for some constraints. Let’s use the following:

  • Box constraints
  • Leverage (weight sum)

# Box
port <- add.constraint(port, type = "box", min = 0.05, max = 0.8)

# Leverage
port <- add.constraint(portfolio = port, type = "full_investment")

Let’s use the built-in random solver. This essentially creates a set of feasible portfolios that satisfy all the constraints we have specified. For a full list of supported constraints see here

# Generate random portfolios
rportfolios <- random_portfolios(port, permutations = 500000, rp_method = "sample")

Now let’s add some objectives and optimize. For simplicity’s sake let’s do some mean-variance optimization.

# Get minimum variance portfolio
minvar.port <- add.objective(port, type = "risk", name = "var")

# Optimize
minvar.opt <- optimize.portfolio(returns.data, minvar.port, optimize_method = "random", 
                                 rp = rportfolios)

# Generate maximum return portfolio
maxret.port <- add.objective(port, type = "return", name = "mean")

# Optimize
maxret.opt <- optimize.portfolio(returns.data, maxret.port, optimize_method = "random", 
                                 rp = rportfolios)

# Generate vector of returns
minret <- 0.06/100
maxret <- maxret.opt$weights %*% meanReturns

vec <- seq(minret, maxret, length.out = 100)

Now that we have the minimum variance as well as the maximum return portfolios, we can build out the efficient frontier. Let’s add a weight concentration objective as well to ensure we don’t get highly concentrated portfolios.

Note:

  • random_portfolios() ignores any diversification constraints. Hence, we didn’t add it previously.
  • Using the random solver for each portfolio in the loop below would be very compute intensive. We’ll use the ROI (R Optmization Infrastructure) solver instead.

eff.frontier <- data.frame(Risk = rep(NA, length(vec)),
                           Return = rep(NA, length(vec)), 
                           SharpeRatio = rep(NA, length(vec)))

frontier.weights <- mat.or.vec(nr = length(vec), nc = ncol(returns.data))
colnames(frontier.weights) <- colnames(returns.data)

for(i in 1:length(vec)){
  eff.port <- add.constraint(port, type = "return", name = "mean", return_target = vec[i])
  eff.port <- add.objective(eff.port, type = "risk", name = "var")
  # eff.port <- add.objective(eff.port, type = "weight_concentration", name = "HHI",
  #                            conc_aversion = 0.001)

  eff.port <- optimize.portfolio(returns.data, eff.port, optimize_method = "ROI")
  
  eff.frontier$Risk[i] <- sqrt(t(eff.port$weights) %*% covMat %*% eff.port$weights)
  
  eff.frontier$Return[i] <- eff.port$weights %*% meanReturns
  
  eff.frontier$Sharperatio[i] <- eff.port$Return[i] / eff.port$Risk[i]
  
  frontier.weights[i,] = eff.port$weights
  
  print(paste(round(i/length(vec) * 100, 0), "% done..."))
}

Now lets plot !

feasible.sd <- apply(rportfolios, 1, function(x){
  return(sqrt(matrix(x, nrow = 1) %*% covMat %*% matrix(x, ncol = 1)))
})

feasible.means <- apply(rportfolios, 1, function(x){
  return(x %*% meanReturns)
})

feasible.sr <- feasible.means / feasible.sd

p <- plot_ly(x = feasible.sd, y = feasible.means, color = feasible.sr, 
        mode = "markers", type = "scattergl", showlegend = F,
        
        marker = list(size = 3, opacity = 0.5, 
                      colorbar = list(title = "Sharpe Ratio"))) %>% 
  
  add_trace(data = eff.frontier, x = Risk, y = Return, mode = "markers", 
            type = "scattergl", showlegend = F, 
            marker = list(color = "#F7C873", size = 5)) %>% 
  
  layout(title = "Random Portfolios with Plotly",
         yaxis = list(title = "Mean Returns", tickformat = ".2%"),
         xaxis = list(title = "Standard Deviation", tickformat = ".2%"),
         plot_bgcolor = "#434343",
         paper_bgcolor = "#F8F8F8",
         annotations = list(
           list(x = 0.4, y = 0.75, 
                ax = -30, ay = -30, 
                text = "Efficient frontier", 
                font = list(color = "#F6E7C1", size = 15),
                arrowcolor = "white")
         ))

The chart above is plotting 42,749 data points ! Also, you’ll notice that since the portfolios on the frontier(beige dots) have an added weight concentration objective, thefrontier seems sub optimal. Below is a comparison.

Let’s also plot the weights to check how diversified our optimal portfolios are. We’ll use a barchart for this.

frontier.weights.melt <- reshape2::melt(frontier.weights)

q <- plot_ly(frontier.weights.melt, x = Var1, y = value, group = Var2, type = "bar") %>%
  layout(title = "Portfolio weights across frontier", barmode = "stack",
         xaxis = list(title = "Index"),
         yaxis = list(title = "Weights(%)", tickformat = ".0%"))

Tufte style visualizations in R using Plotly

$
0
0

This post is inspired by Lukasz Piwek’s awesome Tufte in R post. We’ll try to replicate Tufte’s visualization practices in R using Plotly. You can read more about Edward Tufte here.

One easy way to replicate the graphs showcased on Lukasz’s blog would be to simply use ggplotly() on his ggplot2() code.

We’ll use plot_ly() instead.

Minimal Line Plot

library(plotly)

x <- 1967:1977
y <- c(0.5,1.8,4.6,5.3,5.3,5.7,5.4,5,5.5,6,5)
hovertxt <- paste("Year: ", x, "<br>", "Exp: ", y)
  
plot_ly(x = x, y = y, mode = "line + markers", name = "",
        marker = list(color = "#737373", size = 8), 
        line = list(width = 1), showlegend = F, hoverinfo = "text", text = hovertxt) %>% 
  
  add_trace(x = c(1966.75, 1977.25), y = c(5, 5), 
            mode = "lines", line = list(dash = "5px", color = "#737373"), 
            showlegend = F, hoverinfo = "none") %>% 
  
  add_trace(x = c(1966.75, 1977.25), y = c(6, 6), 
            mode = "lines", line = list(dash = "5px", color = "#737373"), 
            showlegend = F, hoverinfo = "none") %>% 
  
  layout(xaxis = list(title = "", showgrid = F, tickmode = "array",  
                      type = "linear", autorange = F, range = c(1966.75, 1977.25),
                      tickvals = x, 
                      tickfont = list(family = "serif", size = 10), ticks = "outside"),
         
         yaxis = list(title = "", showgrid = F, tickmode = "array",  
                      type = "linear", 
                      tickvals = 1:6, ticktext = paste0("$", c(300, 320, 340, 360, 380, 400)), 
                      tickfont = list(family = "serif", size = 10), ticks = "outside"),
         
         margin = list(r = 20), 
         
         annotations = list(
           list(xref = "x", yref = "y", x = 1977.25, y = 5.5, 
                text = "5%", showarrow = F, ax = 0, ay = 0),
           
           list(xref = "x", yref = "y", x = 1976, y = 1.5, align = "right",
                text = "Per capita<br>budget expenditures<br>in constant dollars", 
                showarrow = F, ax = 0, ay = 0)
         ))

Range-frame (or quartile-frame) scatterplot

library(plotly)

x <- mtcars$wt
y <- mtcars$mpg
hovertxt <- paste("Weight:", x, "<br>", "Miles per gallon: ", y)

plot_ly(x = x, y = y, mode = "markers", marker = list(color = "#737373"), 
        hoverinfo = "text", text = hovertxt) %>% 
  layout(xaxis = list(title = "Car weight (lb/1000)", titlefont = list(family = "serif"), 
                      showgrid = F, tickmode = "array",  
                      tickvals = summary(x), ticktext = round(summary(x), 1),
                      tickfont = list(family = "serif", size = 10), ticks = "outside"),
         
         yaxis = list(title = "Miles per gallon of fuel", titlefont = list(family = "serif"),
                      showgrid = F, tickmode = "array",  
                      tickvals = summary(y), ticktext = round(summary(y), 1),
                      tickfont = list(family = "serif", size = 10), ticks = "outside"))

Dot-dash (Rug) plot

library(plotly)
library(dplyr)

x <- mtcars$wt
y <- mtcars$mpg
hovertxt <- paste("Weight:", x, "<br>", "Miles per gallon: ", y)


ds <- data.frame(x, y, labelsx = round(x, 0), labelsy = round(y,0))
ds <- ds %>% arrange(x)
ds$labelsx <- c(rep("", 7), 2, 
                rep("", 12), 3,
                rep("", 7), 4,
                rep("", 2), 5)

ds <- ds %>% arrange(y)
ds$labelsy <- c(rep("", 1), 10, 
                rep("", 5), 15,
                rep("", 8), 20,
                rep("", 8), 26,
                rep("", 5), 34)


plot_ly(ds, x = x, y = y, mode = "markers", marker = list(color = "#737373"), 
        hoverinfo = "text", text = hovertxt) %>% 
  layout(xaxis = list(title = "Car weight (lb/1000)", titlefont = list(family = "serif"), 
                      showgrid = F,tickmode = "array",
                      tickvals = x, ticktext = labelsx, ticklen = 10,
                      tickfont = list(family = "serif", size = 10), ticks = "outside"),
         
         yaxis = list(title = "Miles Per Gallon of Fuel", titlefont = list(family = "serif"), 
                      showgrid = F,tickmode = "array",  
                      tickvals = y, ticktext = labelsy, ticklen = 10,
                      tickfont = list(family = "serif", size = 10), ticks = "outside"))

Minimal Boxplot

This one needs a little bit of work. Since geom_tufteboxplot() is not yet supported, using ggplotly() won’t work either.

library(plotly)

# Empty plot
p <- plot_ly()

vec <- sort(unique(quakes$mag))

# Each mean (dot) and quartile (line - segment) will have to be added as a separate trace

for(i in vec){
  summ <- boxplot.stats(subset(quakes, mag == i)$stations)$stats
  hovertxt <- paste("Mean:", summ[3], "<br>",
                    "IQR:", IQR(subset(quakes, mag == i)$stations))

  p <- add_trace(p, x = i, y = summ[3], mode = "markers", hoverinfo = "text", text = hovertxt,
                 marker = list(color = "#737373", size = 6), evaluate = T, showlegend = F)
  
  p <- add_trace(p, x = c(i, i), y = c(summ[1], summ[2]), mode = "lines", hoverinfo = "none", 
                 marker = list(color = "#737373"),
                 line = list(width = 1), evaluate = T, showlegend = F)
  
  p <- add_trace(p, x = c(i, i), y = c(summ[4], summ[5]), mode = "lines", hoverinfo = "none",
                 marker = list(color = "#737373"),
                 line = list(width = 1), evaluate = T, showlegend = F)
  
  
}

# Layout options
p <- layout(p, 
            xaxis = list(showgrid = F, nticks = length(vec)),
            yaxis = list(showgrid = F),
            annotations = list(
              list(xanchor = "left", x = 4, y = 120, 
                   text = "Number of stations<br>reporting Richter Magnitude<br>of Fiji earthquakes (n=1000)",
                   align = "left",
                   showarrow = F, ax = 0, ay = 0)))
p

Minimal Barchart

library(psych)
library(reshape2)

ds <- melt(colMeans(msq[,c(2,7,34,36,42,43,46,55,68)],na.rm = T)*10)
ds$trait <- rownames(ds)
hovertxt <- paste(ds$trait, ":", round(ds$value,3))

plot_ly(ds, x = 1:nrow(ds), y = value, type = "bar", marker = list(color = "#737373"), 
        hoverinfo = "text", showlegend = F, text = hovertxt) %>% 
  
  add_trace(x = c(0.4, 9.6, NA, 0.4, 9.6, NA, 0.4, 9.6, NA, 0.4, 9.6, NA, 0.4, 9.6), 
            y = c(1, 1, NA, 2, 2, NA, 3, 3, NA, 4, 4, 5, 5), mode = "lines", 
            marker = list(color = "white"), showlegend = F) %>% 
  
  layout(xaxis = list(title = "", tickmode = "array", tickvals = 1:nrow(ds), ticktext = trait,
                      tickfont = list(family = "serif", size = 10)),
         yaxis = list(title = "", showgrid = F), 
         annotations = list(
           list(x = 1, xanchor = "left", y = 6, showarrow = F, ax = 0, ay = 0, align = "left",
                text = "Average scores<br>on negative emotion traits<br>from 3896 participants<br>(Watson et al., 1988)")))

Candlestick charts using Plotly and Quantmod

$
0
0

This post is dedicated to creating candlestick charts using Plotly’s R-API.

For more information on candlestick charts visit www.stockcharts.com.

We’ll also showcase Plotly’s awesome new range selector feature !

plotlyCandleStick <- function(symbol = "MSFT",
                              fillcolor = "#ff6666",
                              hollowcolor = "#39ac73",
                              linewidth = 4,
                              plotcolor = "#3E3E3E",
                              papercolor = "#1E2022",
                              fontcolor = "#B3A78C",
                              startdate = "2015-01-01"){
  
  # Get OHLC prices using quantmod
  prices <- getSymbols(symbol, auto.assign = F)
  prices <- prices[index(prices) >= startdate]
  
  # Convert to dataframe
  prices <- data.frame(time = index(prices),
                       open = as.numeric(prices[,1]),
                       high = as.numeric(prices[,2]),
                       low = as.numeric(prices[,3]),
                       close = as.numeric(prices[,4]),
                       volume = as.numeric(prices[,5]))
  
  # Create line segments for high and low prices
  plot.base <- data.frame()
  plot.hollow <- data.frame()
  plot.filled <- data.frame()
  
  for(i in 1:nrow(prices)){
    x <- prices[i, ]
    
    # For high / low
    mat <- rbind(c(x[1], x[3]), 
                 c(x[1], x[4]),
                 c(NA, NA))
    
    plot.base <- rbind(plot.base, mat)
    
    # For open / close
    if(x[2] > x[5]){
      mat <- rbind(c(x[1], x[2]), 
                   c(x[1], x[5]),
                   c(NA, NA))
      
      plot.filled <- rbind(plot.filled, mat)
    }else{
      mat <- rbind(c(x[1], x[2]), 
                   c(x[1], x[5]),
                   c(NA, NA))
      
      plot.hollow <- rbind(plot.hollow, mat)
    }
  }  
  
  colnames(plot.base) <- colnames(plot.hollow) <- colnames(plot.filled) <- c("x", "y")
  plot.base$x <- as.Date(as.numeric(plot.base$x))
  plot.hollow$x <- as.Date(as.numeric(plot.hollow$x))
  plot.filled$x <- as.Date(as.numeric(plot.filled$x))
  
  hovertxt <- paste("Date: ", round(prices$time,2), "<br>",
                    "High: ", round(prices$high,2),"<br>",
                    "Low: ", round(prices$low,2),"<br>",
                    "Open: ", round(prices$open,2),"<br>",
                    "Close: ", round(prices$close,2))
  
  
  # Base plot for High / Low prices
  p <- plot_ly(plot.base, x = x, y = y, mode = "lines", 
               marker = list(color = '#9b9797'),
               line = list(width = 1),
               showlegend = F,
               hoverinfo = "none")
  
  # Trace for when open price > close price
  p <- add_trace(p, data = plot.filled, x = x, y = y, mode = "lines", 
                 marker = list(color = fillcolor),
                 line = list(width = linewidth),
                 showlegend = F,
                 hoverinfo = "none")
  
  # Trace for when open price < close price
  p <- add_trace(p, data = plot.hollow, x = x, y = y, mode = "lines", 
                 marker = list(color = hollowcolor),
                 line = list(width = linewidth),
                 showlegend = F,
                 hoverinfo = "none")
  
  # Trace for volume
  p <- add_trace(p, data = prices, x = time, y = volume/1e6, type = "bar",
                 marker = list(color = "#ff9933"),
                 showlegend = F,
                 hoverinfo = "x+y",
                 yaxis = "y2")
  
  # Trace for hover info
  p <- add_trace(p, data = prices, x = time, y = high, opacity = 0, hoverinfo = "text",
                 text = hovertxt, showlegend = F)
  
  # Layout options
  p <- layout(p, xaxis = list(title = "", showgrid = F, 
                              tickformat = "%b-%Y", 
                              tickfont = list(color = fontcolor),
                              rangeselector = list(
                                x = 0.85, y = 0.97, bgcolor = "fontcolor",
                                buttons = list(
                                  list(
                                    count = 3, 
                                    label = "3 mo", 
                                    step = "month",
                                    stepmode = "backward"),
                                  list(
                                    count = 6, 
                                    label = "6 mo", 
                                    step = "month",
                                    stepmode = "backward"),
                                  list(
                                    count = 1, 
                                    label = "1 yr", 
                                    step = "year",
                                    stepmode = "backward"),
                                  list(
                                    count = 1, 
                                    label = "YTD", 
                                    step = "year",
                                    stepmode = "todate"),
                                  list(step = "all")))),
              
              yaxis = list(title = "Price", gridcolor = "#8c8c8c",
                           tickfont = list(color = fontcolor), 
                           titlefont = list(color = fontcolor),
                           domain = c(0.30, 0.95)),
              
              yaxis2 = list(gridcolor = "#8c8c8c",
                            tickfont = list(color = fontcolor), 
                            titlefont = list(color = fontcolor),
                            side = "right", 
                            domain = c(0, 0.2)),
              
              paper_bgcolor = papercolor,
              plot_bgcolor = plotcolor,
              margin = list(r = 50, t = 50),
              
              annotations = list(
                list(x = 0.02, y = 0.25, text = "Volume(mil)", ax = 0, ay = 0, align = "left",
                     xref = "paper", yref = "paper", xanchor = "left", yanchor = "top",
                     font = list(size = 20, color = fontcolor)),
                
                list(x = 0, y = 1, text = symbol, ax = 0, ay = 0, align = "left",
                     xref = "paper", yref = "paper", xanchor = "left", yanchor = "top",
                     font = list(size = 20, color = fontcolor)), 
                
                list(x = 0.1, y = 1, 
                     text = paste("Start: ", format(min(prices$time), "%b-%Y"),
                                  "<br>End: ", format(max(prices$time), "%b-%Y")),
                     ax = 0, ay = 0, align = "left",
                     xref = "paper", yref = "paper", xanchor = "left", yanchor = "top",
                     font = list(size = 10, color = fontcolor))
              ))
  
  return(p)
}

library(plotly)
library(quantmod)

plotlyCandleStick("TSLA")

Ternary Plots in R using Plotly

$
0
0

Plotly now supports ternary plots and in this post we’ll showcase how to make such charts in R !

library(plotly)
library(jsonlite)

URL <- "https://gist.githubusercontent.com/davenquinn/988167471993bc2ece29/raw/f38d9cb3dd86e315e237fde5d65e185c39c931c2/data.json"
ds <- fromJSON(txt = "URL")

colors = c('#8dd3c7','#ffffb3','#bebada',
          '#fb8072','#80b1d3','#fdb462',
          '#b3de69','#fccde5','#d9d9d9',
          '#bc80bd','#ccebc5','#ffed6f')

Markers

p <- plot_ly()
for(i in 1:length(ds)){
  p <- add_trace(p, data = ds[[i]], a = clay, b = sand, c = silt,
                 type = "scatterternary",
                 mode = "markers",
                 evaluate = T,
                 line = list(color = "black"))
}

p <- layout(p, title ="", showlegend = F,
            xaxis = list(title = "", showgrid = F, zeroline = F, showticklabels = F),
            yaxis = list(title = "", showgrid = F, zeroline = F, showticklabels = F),
            sum = 100,
            ternary = list(
              aaxis = list(title = "Clay", tickformat = ".0%", tickfont = list(size = 10)),
              baxis = list(title = "Sand", tickformat = ".0%", tickfont = list(size = 10)),
              caxis = list(title = "Silt", tickformat = ".0%", tickfont = list(size = 10))),
            annotations = list(
              list(xref = "paper", yref = "paper", align = "center",
                   x = 0.1, y = 1, text = "Ternary Plot in R<br>(Markers)", ax = 0, ay = 0,
                   font = list(family = "serif", size = 15, color = "white"),
                   bgcolor = "#b3b3b3", bordercolor = "black", borderwidth = 2)))
p

Lines

p <- plot_ly()
for(i in 1:length(ds)){
  p <- add_trace(p, data = ds[[i]], a = clay, b = sand, c = silt,
                 type = "scatterternary",
                 mode = "lines",
                 evaluate = T,
                 line = list(color = "black"))
}

p <- layout(p, title ="", showlegend = F,
            xaxis = list(title = "", showgrid = F, zeroline = F, showticklabels = F),
            yaxis = list(title = "", showgrid = F, zeroline = F, showticklabels = F),
            sum = 100,
            ternary = list(
              aaxis = list(title = "Clay", tickformat = ".0%", tickfont = list(size = 10)),
              baxis = list(title = "Sand", tickformat = ".0%", tickfont = list(size = 10)),
              caxis = list(title = "Silt", tickformat = ".0%", tickfont = list(size = 10))),
            annotations = list(
              list(xref = "paper", yref = "paper", align = "center",
                   x = 0.1, y = 1, text = "Ternary Plot in R<br>(Lines)", ax = 0, ay = 0,
                   font = list(family = "serif", size = 15, color = "white"),
                   bgcolor = "#b3b3b3", bordercolor = "black", borderwidth = 2)))
p

Contour

p <- plot_ly()
for(i in 1:length(ds)){
  p <- add_trace(p, data = ds[[i]], a = clay, b = sand, c = silt,
                 type = "scatterternary",
                 mode = "lines",
                 fill = "toself",
                 fillcolor = colors[i],
                 evaluate = T,
                 line = list(color = "black"))
}

p <- layout(p, title ="", showlegend = F,
       xaxis = list(title = "", showgrid = F, zeroline = F, showticklabels = F),
       yaxis = list(title = "", showgrid = F, zeroline = F, showticklabels = F),
       sum = 100,
       ternary = list(
         aaxis = list(title = "Clay", tickformat = ".0%", tickfont = list(size = 10)),
         baxis = list(title = "Sand", tickformat = ".0%", tickfont = list(size = 10)),
         caxis = list(title = "Silt", tickformat = ".0%", tickfont = list(size = 10))),
       annotations = list(
         list(xref = "paper", yref = "paper", align = "center",
              x = 0.1, y = 1, text = "Ternary Plot in R<br>(Contour)", ax = 0, ay = 0,
              font = list(family = "serif", size = 15, color = "white"),
              bgcolor = "#b3b3b3", bordercolor = "black", borderwidth = 2)))
p

Shiny Apps Gallery using Plotly in R

$
0
0

Announcing the new shiny apps gallery that showcases the use of Plotly’s R API in Shiny Applications.

You can visit the gallery here: https://plot.ly/r/shiny-gallery/


Apps showcase the use of a variety of plotly features including:

  • Adding interactive plotly graphs using plotlyOutput()
  • Embedding ggplot style visualizations using ggplotly()
  • Accessing click, hover and zoom events using event_data()

Need help with your shiny app? Visit our community forum at http://community.plot.ly/
You can also tweet us at @plotlygraphs

Want to report a bug? Visit https://github.com/ropensci/plotly

Need more help? Consider upgrading to one of our premium / enterprise plans


Gantt Charts in R using Plotly

$
0
0

Gantt Charts are a great way to keep track of timelines, progress of specific aspects of the project and resource utilization. Project Managers and anyone familiar with Microsoft Project would be familiar with Gantt Charts.

Here’s how to make one in R using Plotly’s R API.

library(plotly)

# Read in data
df <- read.csv("https://cdn.rawgit.com/plotly/datasets/master/GanttChart-updated.csv", stringsAsFactors = F)

# Convert to dates
df$Start <- as.Date(df$Start, format = "%m/%d/%Y")

# Sample client name
client = "Sample Client"

# Choose colors based on number of resources
cols <- RColorBrewer::brewer.pal(length(unique(df$Resource)), name = "Set3")
df$color <- factor(df$Resource, labels = cols)

# Initialize empty plot
p <- plot_ly()

# Each task is a separate trace
# Each trace is essentially a thick line plot
# x-axis ticks are dates and handled automatically

for(i in 1:(nrow(df) - 1)){
  p <- add_trace(p,
                 x = c(df$Start[i], df$Start[i] + df$Duration[i]),  # x0, x1
                 y = c(i, i),  # y0, y1
                 mode = "lines",
                 line = list(color = df$color[i], width = 20),
                 showlegend = F,
                 hoverinfo = "text",
                 
                 # Create custom hover text
                 
                 text = paste("Task: ", df$Task[i], "<br>",
                              "Duration: ", df$Duration[i], "days<br>",
                              "Resource: ", df$Resource[i]),
                 
                 evaluate = T  # needed to avoid lazy loading
                 )
}


# Add information to plot and make the chart more presentable

p <- layout(p,
            
            # Axis options:
            # 1. Remove gridlines
            # 2. Customize y-axis tick labels and show task names instead of numbers
            
            xaxis = list(showgrid = F, tickfont = list(color = "#e6e6e6")),
            
            yaxis = list(showgrid = F, tickfont = list(color = "#e6e6e6"),
                         tickmode = "array", tickvals = 1:nrow(df), ticktext = unique(df$Task),
                         domain = c(0, 0.9)),
            
            # Annotations
            
            annotations = list(
              # Add total duration and total resources used
              # x and y coordinates are based on a domain of [0,1] and not
              # actual x-axis and y-axis values
              
              list(xref = "paper", yref = "paper",
                   x = 0.80, y = 0.1,
                   text = paste0("Total Duration: ", sum(df$Duration), " days<br>",
                                 "Total Resources: ", length(unique(df$Resource)), "<br>"),
                   font = list(color = "#ffff66", size = 12),
                   ax = 0, ay = 0,
                   align = "left"),
              
              # Add client name and title on top
              
              list(xref = "paper", yref = "paper",
                   x = 0.1, y = 1, xanchor = "left",
                   text = paste0("Gantt Chart: ", client),
                   font = list(color = "#f2f2f2", size = 20, family = "Times New Roman"),
                   ax = 0, ay = 0,
                   align = "left")
            ),
            
            plot_bgcolor = "#333333",  # Chart area color
            paper_bgcolor = "#333333")  # Axis area color

p

Bullet Charts in R using Plotly

$
0
0

This post is inspired by Mike Bostock’s implementation of bullet charts – http://bl.ocks.org/mbostock/4061961

library(plotly)
library(jsonlite)
library(dplyr)

# Read data
df <- fromJSON(txt = url("https://cdn.rawgit.com/plotly/datasets/master/BulletData.json"))

# Convert to conventional format
df <- t(apply(df, 1, function(vec){
  vec <- unlist(vec)
  return(vec)
}))

df <- as.data.frame(df, stringsAsFactors = F)
p <- list()

# Set line widths
innerwidth <- 10
outerwidth <- 25

for(i in 1:nrow(df)){
  p[[i]] <- 
    
    # Ranges3
    plot_ly(df[i,], 
            x = c(0, as.numeric(ranges3)),
            y = c(title, title),
            name = "Range3",
            hoverinfo = "x",
            mode = "lines",
            line = list(color = "#eeeeee", width = outerwidth),
            evaluate = T) %>% 
    
    # Ranges2
    add_trace(x = c(0, as.numeric(ranges2)),
              y = c(title, title),
              hoverinfo = "x",
              mode = "lines",
              line = list(color = "#dddddd", width = outerwidth),
              evaluate = T) %>%
    
    # Ranges1
    add_trace(x = c(0, as.numeric(ranges1)),
              y = c(title, title),
              hoverinfo = "x",
              line = list(color = "#cccccc", width = outerwidth),
              evaluate = T) %>% 
    
    
    # Measure2
    add_trace(x = c(0, as.numeric(measures2)),
              y = c(title, title),
              mode = "lines",
              hoverinfo = "x",
              line = list(color = "#b0c4de", width = innerwidth),
              evaluate = T) %>% 
    
    # Measure1
    add_trace(x = c(0, as.numeric(measures1)),
              y = c(title, title),
              mode = "lines",
              hoverinfo = "x",
              line = list(color = "#4682b4", width = innerwidth),
              evaluate = T) %>% 
    
    # Marker
    add_trace(x = as.numeric(markers),
              y = title,
              mode = "markers",
              hoverinfo = "x",
              marker = list(color = "black", symbol = "diamond-tall", size = 10),
              evaluate = T) %>% 
    
    layout(showlegend = F, 
           xaxis = list(title = "", showgrid = F, zeroline = F, 
                        range = c(-(as.numeric(ranges3)/10), as.numeric(ranges3)),
                        ticklen = 7,
                        tickfont = list(family = "Arial", size = 10),
                        tickcolor = "#cccccc"),
           
           yaxis = list(title = "",
                        showgrid = F, 
                        zeroline = F,
                        showticklabels = F))
}

pp <- subplot(p[[1]], p[[2]], p[[3]], p[[4]], p[[5]],
        nrows = 5, 
        margin = c(0, 0, 0.1, 0))

# Add Y-Axis titles
pp <- layout(pp,
       annotations = list(
         
         list(xref = "paper", yref = "paper", 
              x = 0, y = 0.05, ax = 0, ay = 0, xanchor = "right",
              text = paste0("<b>", df[1,1], "</b>","<br>",
                            '<span style = "color:grey; font-size:75%">', 
                            df[1,2], "</span>"),
              align = "right",
              font = list(family = "arial",
                          size = 15)),
         
         list(xref = "paper", yref = "paper", 
              x = 0, y = 0.25, ax = 0, ay = 0, xanchor = "right",
              text = paste0("<b>", df[2,1], "</b>","<br>",
                            '<span style = "color:grey; font-size:75%">', 
                            df[2,2], "</span>"),
              align = "right",
              font = list(family = "arial",
                          size = 15)),
         
         list(xref = "paper", yref = "paper", 
              x = 0, y = 0.45, ax = 0, ay = 0, xanchor = "right",
              text = paste0("<b>", df[3,1], "</b>","<br>",
                            '<span style = "color:grey; font-size:75%">', 
                            df[3,2], "</span>"),
              align = "right",
              font = list(family = "arial",
                          size = 15)),
         
         list(xref = "paper", yref = "paper", 
              x = 0, y = 0.65, ax = 0, ay = 0, xanchor = "right",
              text = paste0("<b>", df[4,1], "</b>","<br>",
                            '<span style = "color:grey; font-size:75%">', 
                            df[4,2], "</span>"),
              align = "right",
              font = list(family = "arial",
                          size = 15)),
         
         list(xref = "paper", yref = "paper", 
              x = 0, y = 0.90, ax = 0, ay = 0, xanchor = "right",
              text = paste0("<b>", df[5,1], "</b>","<br>",
                            '<span style = "color:grey; font-size:75%">', 
                            df[5,2], "</span>"),
              align = "right",
              font = list(family = "arial",
                          size = 15))))

pp

Interactive Heat Maps for R

$
0
0

In every statistical analysis, the first thing one should do is try and visualise the data before any modeling. In microarray studies, a common visualisation is a heatmap of gene expression data.

In this post I simulate some gene expression data and visualise it using the heatmaply package in R by Tal Galili. This package extends the plotly engine to heatmaps, allowing you to inspect certain values of the data matrix by hovering the mouse over a cell. You can also zoom into a region of the heatmap by drawing a rectangle over an area of your choice

The following function simulates data from a multivariate normal distribution, and allows exposure dependent correlations between the data. You will need the mvrnorm function from the MASS library to run this function:

simulateExprData <- function(n, n0, p, rho0, rho1){ 
  # n: total number of subjects 
  # n0: number of subjects with exposure 0 
  # n1: number of subjects with exposure 1 
  # p: number of genes 
  # rho0: rho between Z_i and Z_j for subjects with exposure 0 
  # rho1: rho between Z_i and Z_j for subjects with exposure 1
 
  # Simulate gene expression values according to exposure 0 or 1, 
  # according to a centered multivariate normal distribution with 
  # covariance between Z_i and Z_j being rho^|i-j| 
  n1 <- n - n0 
  times <- 1:p
  H <- abs(outer(times, times, "-")) 
  V0 <- rho0^H 
  V1 <- rho1^H 

  # rows are people, columns are genes 
  genes0 <- MASS::mvrnorm(n = n0, mu = rep(0,p), Sigma = V0) 
  genes1 <- MASS::mvrnorm(n = n1, mu = rep(0,p), Sigma = V1) 
  genes <- rbind(genes0,genes1) 
  return(genes)
}

genes <- simulateExprData(n = 50, n0 = 25, p = 100, 
                          rho0 = 0.01, rho1 = 0.95)

Next we need to install and load the heatmaply package (this also requires the devtools package):

install.packages('devtools')
devtools::install_github('talgalili/heatmaply')
library(heatmaply)

The syntax is extremely simple. Lets plot a few different interactive heatmaps of the data. We first plot the genes and specify how many groups we want for the rows (subjects) and columns (genes) of the data. In this case we specify 2 groups for both the rows and columns:

heatmaply(genes, k_row = 2, k_col = 2)

We see that the clustering algorithm is not able to properly cluster the subjects because we would have expected to see two equal size groups in the dendrogram on the y-axis.

Let’s plot the correlation matrix of the genes:

heatmaply(cor(genes), k_row = 2, k_col = 2)

Power Curves in R Using Plotly ggplot2 Library

$
0
0

When performing Student’s t-test to compare the difference in means between two groups, it is a useful exercise to determine the effect of unequal sample sizes in the comparison groups on power. Formally, power can be defined as the probability of rejecting the null hypothesis when the alternative hypothesis is true. Informally, power is the ability of a statistical test to detect an effect, if the effect actually exists. Large imbalances generally will not have adequate statistical power to detect even large effect sizes associated with a factor, leading to a high Type II error rate.

To jusity this reasoning I performed a power analysis for different group sizes. I considered the following group sizes, where n1 are the number of subjects in group 1 and n2 are the number of subjects in group 2:

  1. n1 = 28, n2 = 1406: n1 represents 2% of the entire sample size of 1434
  2. n1 = 144, n2 = 1290: n1 represents 10% of the entire sample size of 1434
  3. n1 = 287, n2 = 1147: n1 represents 20% of the entire sample size of 1434
  4. n1 = 430, n2 = 1004: n1 represents 30% of the entire sample size of 1434
  5. n1 = 574, n2 = 860: n1 represents 40% of the entire sample size of 1434
  6. n1 = 717, n2 = 717: equal size groups (this is optimal because it leads to the highest power for a given effect size)

In the figure below I plotted the power curves for the t-test, as a function of the effect size, assuming a Type I error rate of 5%. Comparing different power curves (based on the sample size of each group) on the same plot, is a useful visual representation of this analysis. We also plot a horizontal dashed line at an acceptable power level of 80%, and a vertical line at the effect size that would have to be present in our data to achieve 80% power. We see that the effect size must be greater than 0.54 to attain an acceptable power level given highly imbalanced group sizes of n1 = 28 and n2 = 1406, compared to all other scenarios that lead to 100% power.

library(pwr) # for power calcs
library(dplyr) # for data manipulation
library(tidyr) # for data manipulation
library(ggplot2) # for plotting power curves
library(plotly) # for interactive power curves

# Generate power calculations
ptab <- cbind(NULL, NULL)       

for (i in seq(0,1, length.out = 200)){
  pwrt1 <- pwr.t2n.test(n1 = 28, n2 = 1406, 
                        sig.level = 0.05, power = NULL, 
                        d = i, alternative="two.sided")
  pwrt2 <- pwr.t2n.test(n1 = 144, n2 = 1290, 
                        sig.level = 0.05, power = NULL, 
                        d = i, alternative="two.sided")
  pwrt3 <- pwr.t2n.test(n1 = 287, n2 = 1147, 
                        sig.level = 0.05, power = NULL, 
                        d = i, alternative="two.sided")
  pwrt4 <- pwr.t2n.test(n1 = 430, n2 = 1004, 
                        sig.level = 0.05, power = NULL, 
                        d = i, alternative="two.sided")
  pwrt5 <- pwr.t2n.test(n1 = 574, n2 = 860, 
                        sig.level = 0.05, power = NULL, 
                        d = i, alternative="two.sided")
  pwrt6 <- pwr.t2n.test(n1 = 717, n2 = 717, 
                        sig.level = 0.05, power = NULL, 
                        d = i, alternative="two.sided")
  ptab <- rbind(ptab, cbind(pwrt1$d, pwrt1$power,
                            pwrt2$d, pwrt2$power,
                            pwrt3$d, pwrt3$power,
                            pwrt4$d, pwrt4$power,
                            pwrt5$d, pwrt5$power,
                            pwrt6$d, pwrt6$power))
}

ptab <- cbind(seq_len(nrow(ptab)), ptab)

colnames(ptab) <- c("id","n1=28, n2=1406.effect size","n1=28, n2=1406.power",
                    "n1=144, n2=1290.effect size","n1=144, n2=1290.power",
                    "n1=287, n2=1147.effect size","n1=287, n2=1147.power",
                    "n1=430, n2=1004.effect size","n1=430, n2=1004.power",
                    "n1=574, n2=860.effect size","n1=574, n2=860.power",
                    "n1=717, n2=717.effect size","n1=717, n2=717.power")

# get data into right format for ggplot2
temp <- ptab %>%
  as.data.frame() %>%
  gather(key = name, value = val, 2:13) %>%
  separate(col = name, into = c("group", "var"), sep = "\\.") %>%
  spread(key = var, value = val)

# factor group
temp$group <- factor(temp$group, 
                levels = c("n1=28, n2=1406", "n1=144, n2=1290", 
                "n1=287, n2=1147", "n1=430, n2=1004",
                "n1=574, n2=860", "n1=717, n2=717"))


# plot
p <- ggplot(temp, aes(x = `effect size`, y = power, color = group))
     geom_line(size=2) + 
     theme_bw() + 
     theme(axis.text=element_text(size=14), 
           axis.title=element_text(size=14), 
           legend.text=element_text(size=14)) +
     geom_vline(xintercept = .54, linetype = 2) +
     geom_hline(yintercept = 0.80, linetype = 2)

# so simple to make interactive plots
plotly::ggplotly(p)

ggplot2 docs completely remade in D3.js

Viewing all 48 articles
Browse latest View live